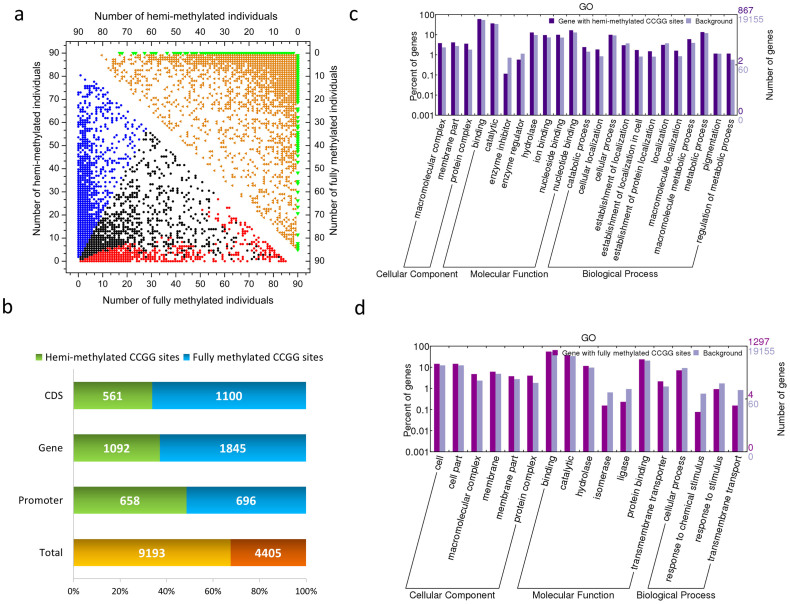
Figure 3. DNA methylation landscape in the Cassava genome.
(a) Graphical representation of the pattern of methylated sites in the cassava KS population. The y-axis and x-axis indicates the number of individuals, which were detected to have either hemi-methylated or fully methylated sites in the KS cassava population. The lower left diagonal region indicates the distribution of hemi-methylated or fully methylated sites. The blue circles represent the hemi-methylated sites (hemi-methylated sites >2/3), while the red circles depict the fully methylated sites (fully methylated sites >2/3). The upper right diagonal region indicates the distribution of DNA methylation polymorphisms for the cassava KS population. The orange triangles represent the polymorphic methylated sites in the population, while the green triangles represent the monomorphic methylated sites. (b) Relative levels of cytosine methylation at the CCGG sites in the cassava KS population. (c, d) Annotation of hemi-methylated (c) and fully methylated (d) genes with BGI WEGO31. Of the 19,155 genes with GO annotations, 867 hemi-methylated and 1297 fully methylated genes showed significant enrichment differences (P<0.05, x2 test) compared with total analysed cassava genes. Annotations are grouped by cellular component, molecular function or biological process based on the JGI cassava gene GO annotation information. Gene numbers and percentages (on a log scale) are listed for each category.

