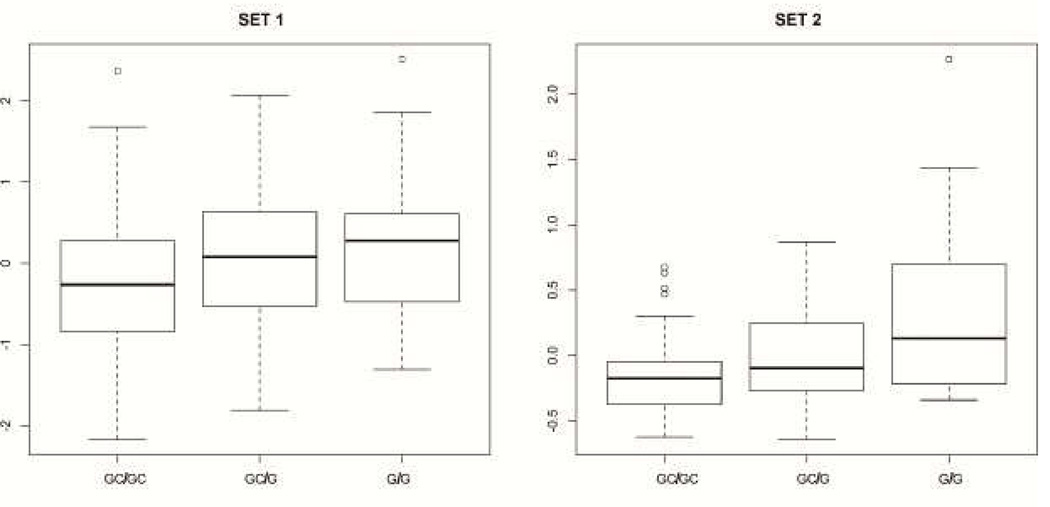
Figure 4. Expression of OXTR by rs3831817 genotypes.
Shown in the figure is a boxplot of rs3831817 genotypes (x-axis) and OXTR transcript levels (y-axis) for each brain profiling set. The adjusted linear p-values comparing allele dose and expression across all genotypes were 0.01113 (set 1) and 0.000721 (set 2).

