
Figure 4. Evidence for a dominant set of NFATc1 target genes.
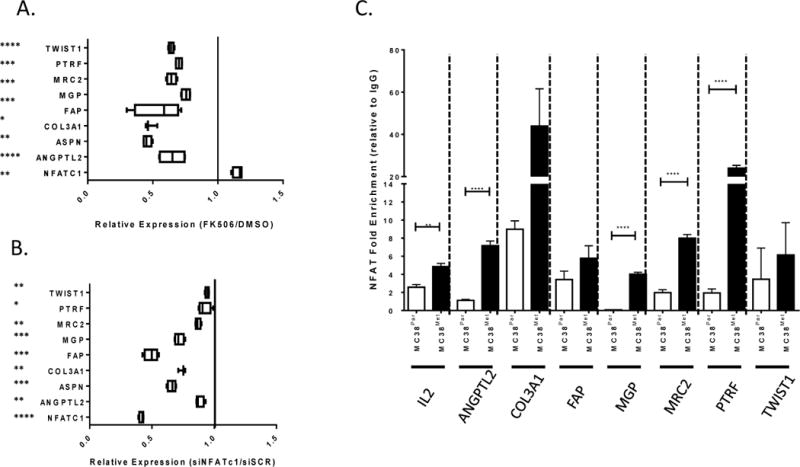
(A) Expression of eight putative target mRNA species significantly associated with NFATc1 expression in MC38Met cells following FK506 treatment (relative to DMSO control, n=4, significance is determined by 1-sample t-test against equivalence or ratio=1 as shown by verticle line). (B) Expression of eight mRNA species significantly associated with NFATc1 expression in HCT116 cells following treatment with NFATc1 specific RNAi (relative to siSCR, n=4, significance is determined by 1-sample t-test against equivalence or ratio=1 as shown by verticle line).(C) Quantification of NFATc1 pull-down on putative target gene specific promoter binding elements relative to IgG control (ASPN mRNA species undetectable, not shown). ns=p>0.05, *p<0.05,**p<0.005,***p<0.0005, ****p<0.00005.