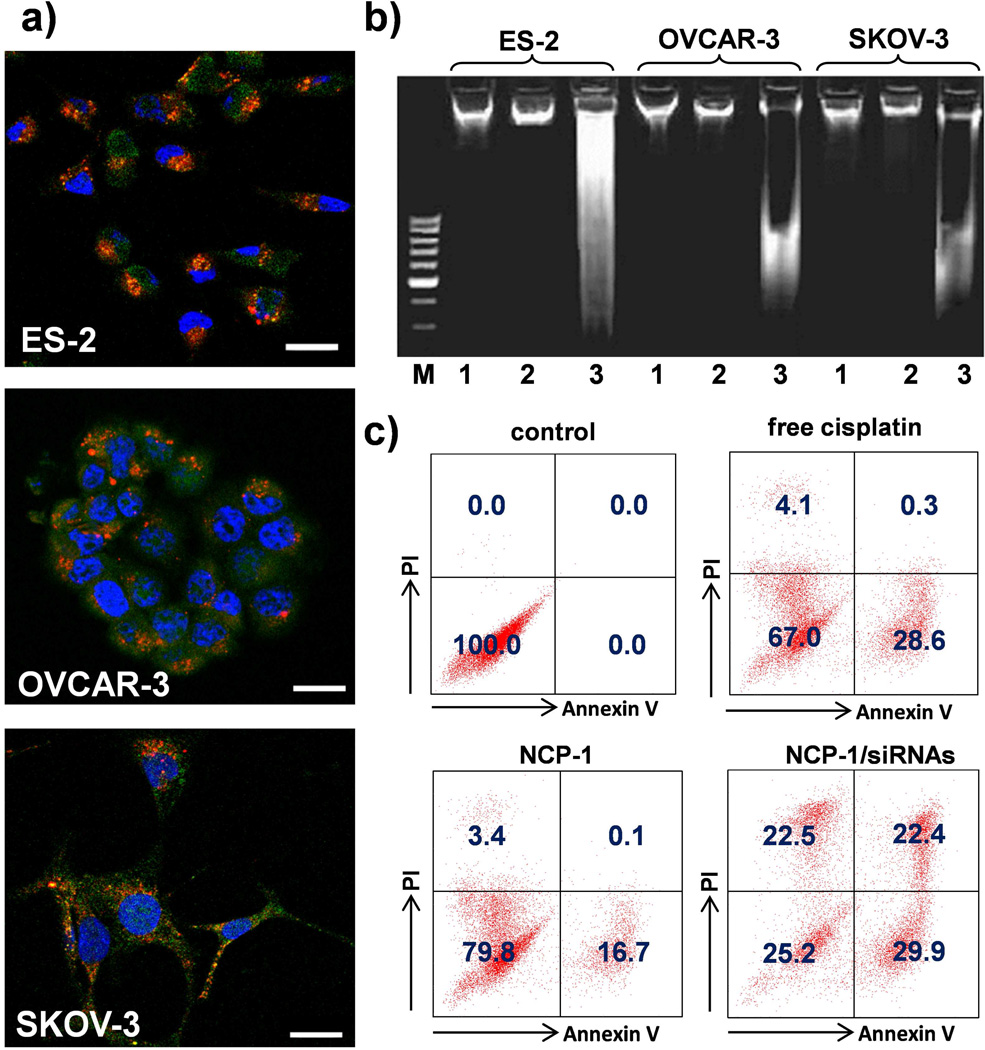
Figure 4.
(a) CLSM images showing cell apoptosis and siRNA internalization in ES-2, OVCAR-3, and SKOV-3 cells after incubation with NCP-1/siRNAs for 24 h. The siRNA was labeled with TAMRA (red fluorescence).The cells were stained with Annexin V FITC Conjugate and the nuclei were stained with DAPI. Bar represented 20 µm. (b) Analysis of DNA ladder on 2% (w/v) agarose gel at 35 V for 5 h after DNA extraction from the ovarian cancers treated with NCP-1 or NCP-1/siRNA. M: DNA marker; 1: control; 2: NCP-1; 3: NCP-1/siRNAs. (c) Annexin V/PI analysis of SKOV-3 cells after the incubation with saline (control), NCP-1, NCP-1/siRNAs and free cisplatin for 24 h. The quadrants from lower left to upper left (counter clockwise) represent healthy, early apoptotic, late apoptotic, and necrotic cells, respectively. The percentage of cells in each quadrant was shown on the graphs.

