Figure 7.

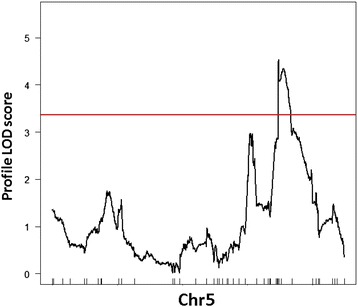
LOD profile for QTL underlying scopolin accumulation in the AI-RILs. One-dimensional LOD profile for the QTL underlying variation in scopolin accumulation (SCL1). Red line represents LOD threshold (3.4).

LOD profile for QTL underlying scopolin accumulation in the AI-RILs. One-dimensional LOD profile for the QTL underlying variation in scopolin accumulation (SCL1). Red line represents LOD threshold (3.4).