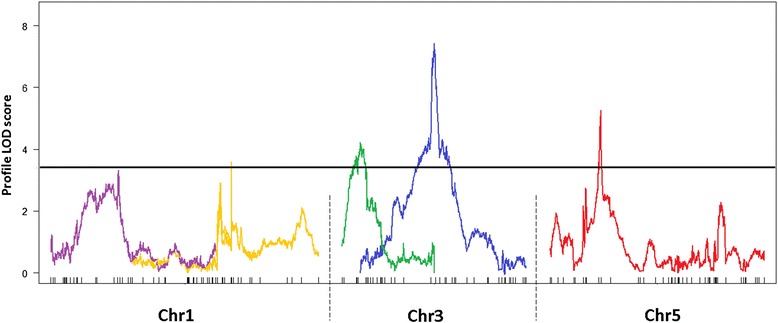
Figure 8.

LOD profiles for QTLs underlying scopoletin accumulation in the AI-RILs. QTLs for scopoletin (SCT1 - SCT5) content. Black line represents LOD threshold (3.4). Profile LOD curves for a five-QTL model was done with formula = y ~ Q1 + Q2 + Q3 + Q4 + Q5. Each QTL is highlighted in different colour.
