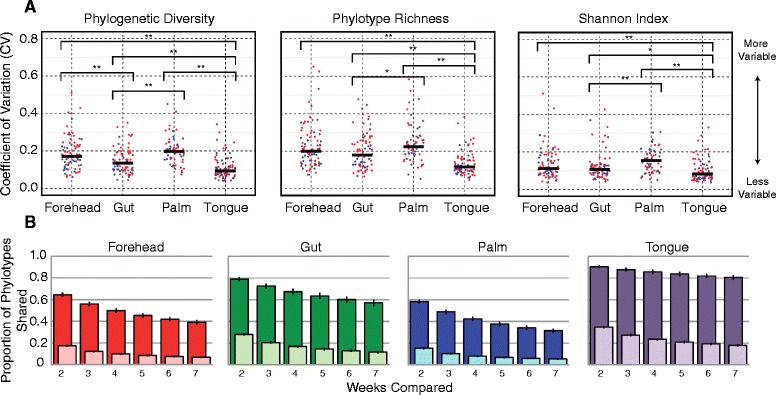
Figure 1.

Body habitats exhibited different levels of temporal variability both in diversity (A) and membership (B). In (A), each point represents the temporal variability of a single individual colored by gender (red = female, blue = male) with black bars representing the median for a given body habitat and metric. Statistical differences were observed for each metric across body habitats (Kruskal-Wallis, P ≤0.01) and comparisons based on pairwise Mann-Whitney U-test are denoted by asterisks (* = corrected P ≤0.05, ** = corrected P ≤0.01). In (B), the smaller, lighter shaded bars in each plot are for all phylotypes except singletons and the larger, darker bars are only for the 100 most abundant phylotypes for each individual. Error bars in (B) are ±1 SEM.
