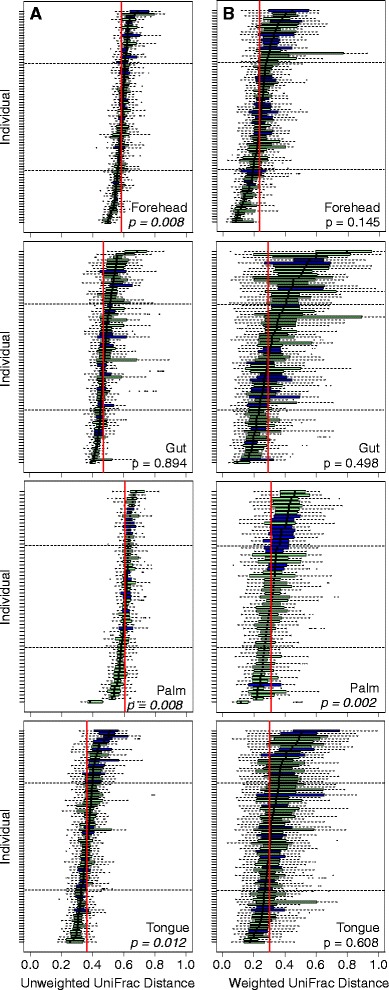
Figure 2.

Boxplots of unweighted (A) and weighted (B) intra-individual UniFrac distances for each body habitat. A broad range of temporal variability in microbial community membership (A) and structure (B) was observed across body habitats and within body habitats across individuals. Individuals are sorted by median in each plot. Green bars depict individuals who did not report antibiotic use during the study period while blue bars indicate individuals who took antibiotics. The median values for each body habitat are shown with vertical red lines. Dotted horizontal lines in each plot divide the study population into first and fourth quartiles and depict ‘stable’ and ‘variable’ individuals, respectively. Non-parametric Mann-Whitney U-tests were used to determine the affect of antibiotic use on temporal variability within each body habitat. P values are shown in each panel. Note that statistical differences were observed for each metric across body habitats (Kruskal-Wallis, P ≤0.01).
