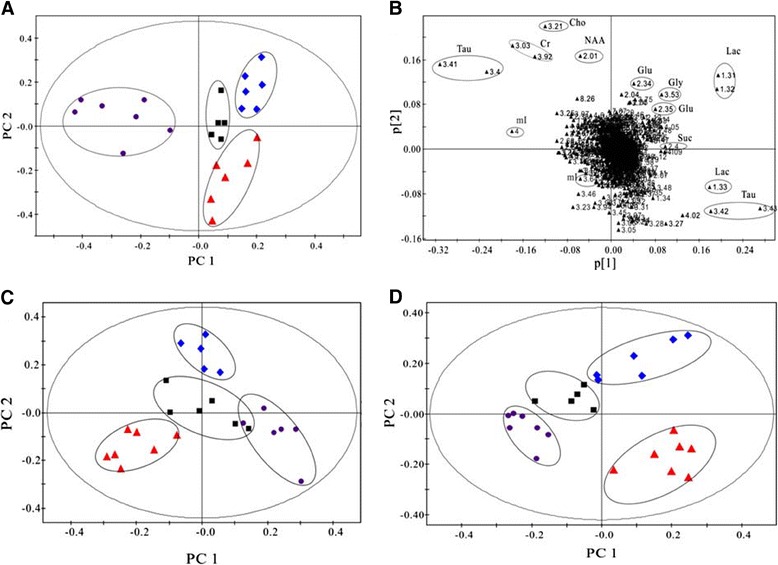
Figure 3.

PLS-DA scores plots of PC1 and PC2 in the hippocampus (A), occipital cortex (C), and cerebellum (D) of BE rats at 0.5 hr (diamond), 4 hr (triangle), 24 hr (circle) and controls (Black square), and the corresponding loading plot of hippocampus (B).
