
Figure 1.
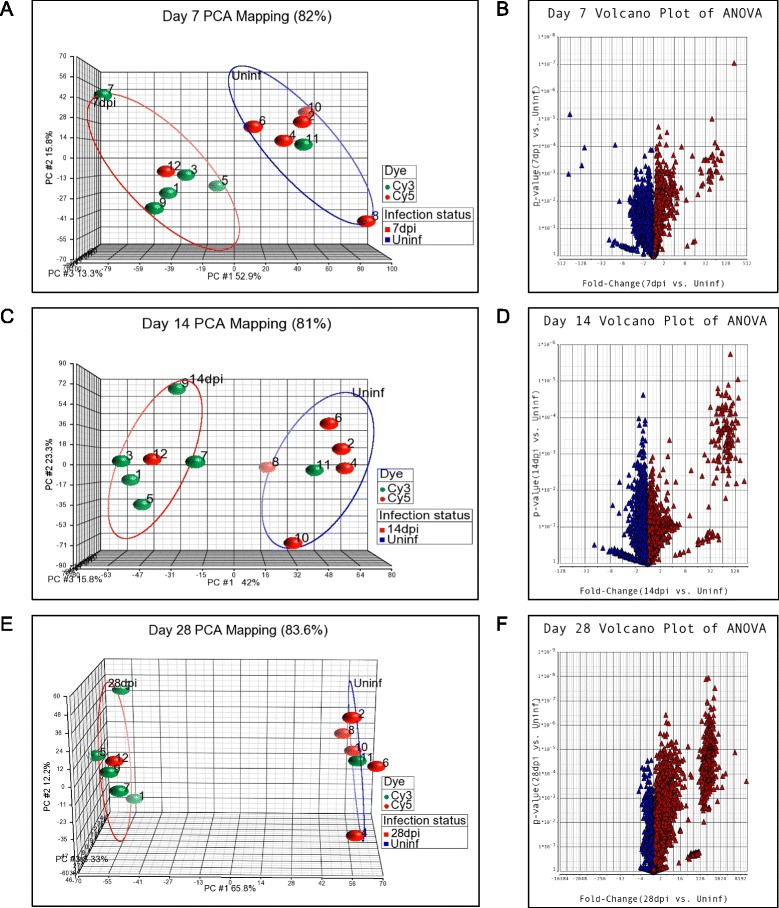
Principle Component Analysis and Volcano Plots of transcripts expressed in the spleens of uninfected or infected hamsters. A, C, E. Principle Component Analysis of uninfected and infected spleen tissue at 7 days (A), 14 days (C), and 28 days (E) post-infection. The groups of uninfected samples are circled in blue and infected samples are circled in red. The Cy3 and Cy5 dyes are represented by green and red symbols, respectively. Dye-swap arrays (files 11 and 12 for each time point) from pooled samples clustered appropriately within the corresponding infection status. B, D, F. Volcano plots showing the mean fold-change and p-value for the comparisons of uninfected and infected spleen tissue at 7 days (B), 14 days (D) and 28 days (F) post-infection. Red triangles show a fold-change >1 and blue triangles show a fold-change <1.