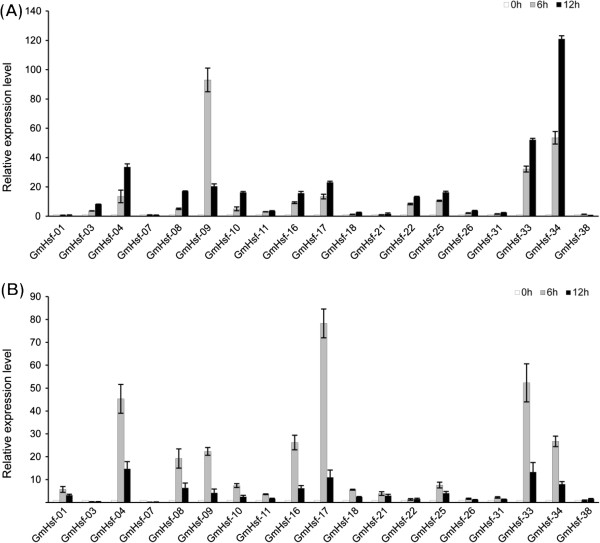
Figure 7.

Relative expressions of soybean Hsf genes under drought and heat conditions. Analyses were carried out by qRT-PCR under drought (A) and heat stress (B) treatment. qRT-PCR data were normalized using soybean Actin (U60506) gene and shown relative to 0 h. X-axes showed soybean Hsf genes and y-axes are scales of relative expression level (error bars indicate SD).
