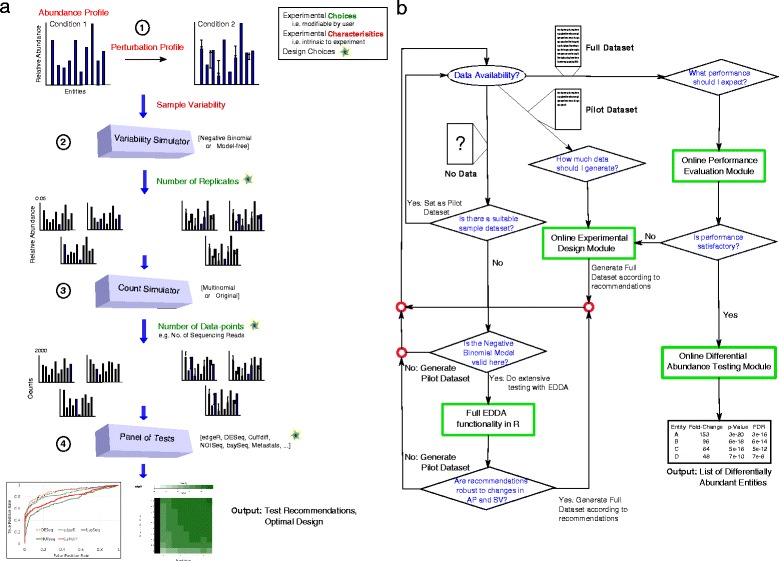
Figure 1.

A schematic overview of EDDA and its usage. (a) Overview of the simulate-and-test approach used in EDDA involving four key steps (see Methods for details). The figure also indicates the various parameters studied here, that impact the ability to predict differentially abundant entities (also see Table 1), in red and green text. (b) A flowchart describing how EDDA can be used to optimize design and performance in a counting experiment. EDDA functionality is depicted in green boxes and rhombi indicate decision nodes.
