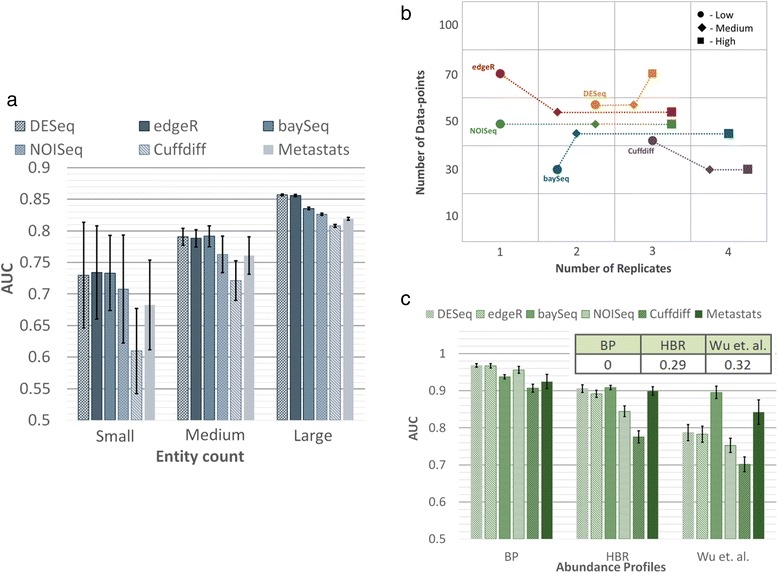
Figure 3.

Performance of DATs as a function of experimental characteristics. (a) AUC as a function of entity count (small =100, medium = 1,000, large =30,000). Simulations were done with the same parameters as in Figure 2a, except with ND =100 per entity, AP = HBR, SM = Full, and FC = Log-normal [1,2]. (b) AUC as a function of SV (and NR, ND per entity), where low, medium, and high were set to SV =0.05, 0.5, and 0.85, respectively. Note that the plotted point shows the smallest NR and ND values (small NR was given priority in the case of ties) that achieved an AUC target of 0.95. Synthetic data were generated with EC =1,000, PDA =10%, FC = Uniform (8, 8), AP = BP, and SM = NB. (c) AUC as a function of abundance profile. Simulations were done with the same parameters as in Figure 2a and with NR =5 and ND =500 per entity. The inset shows the fraction of rare entities (mean count <10) in each abundance profile. Results reported are based on an average over 10 simulations and error bars in (a) and (c) represent one standard deviation.
