
Figure 4.
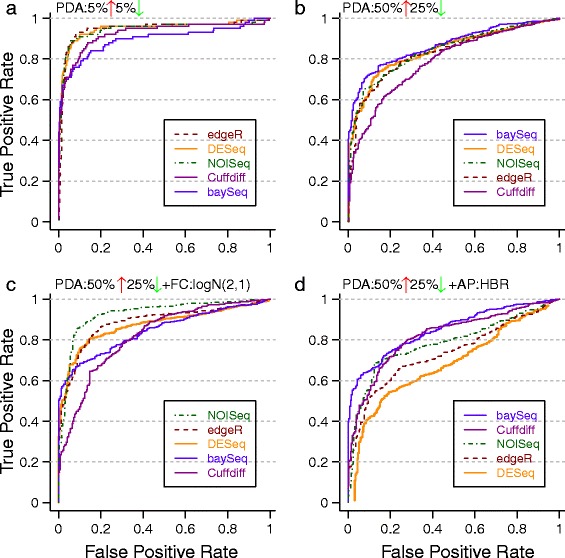
ROC plots under various perturbation profiles. Statistical tests in the legend are listed from best to worst (in terms of AUC values) for each setting. Note the striking reordering of test performance across subfigures with slight changes in experimental conditions. Simulations in EDDA were done with (a) PDA =10%, (b) PDA = (50% UP, 25% DOWN), (c) PDA = (50% UP, 25% DOWN), FC = Log-normal (2, 1), (d) PDA = (50% UP, 25% DOWN), AP = HBR. Unless stated otherwise, common parameters include NR =3, EC =1,000, FC = Uniform(3, 7), ND =500 per entity, AP = BP, SM = Full, and SV =0.5.