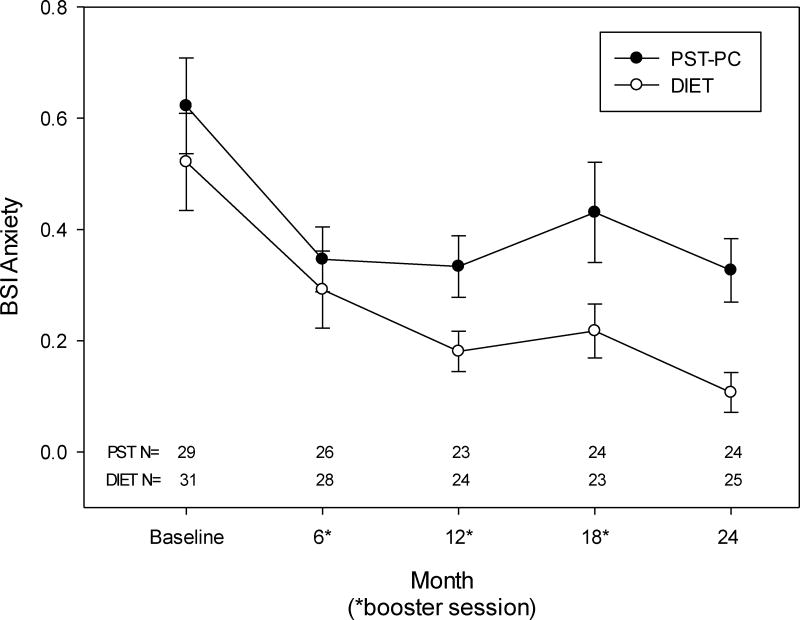
Figure 3.
This figure shows the Brief Symptom Inventory (BSI) anxiety scores (mean ± standard error) over time for Problem Solving Therapy in Primary Care (PST-PC) and dietary education (DIET) interventions. The number of participants at each time point is indicated in the bottom portion of the graph. Time was treated as continuous with actual visit date used to model time. The graph shows data plotted at study designed time points for convenience. We found a significant time effect [linear time: F (1, 194) = 19.15, p <.001 and quadratic time: F(1, 194) = 8.35; p = 0.004]. Thus, both interventions showed improvement over time. However, there were no differences in anxiety scores between groups: [F (1, 194) = 1.36; p = .25].

