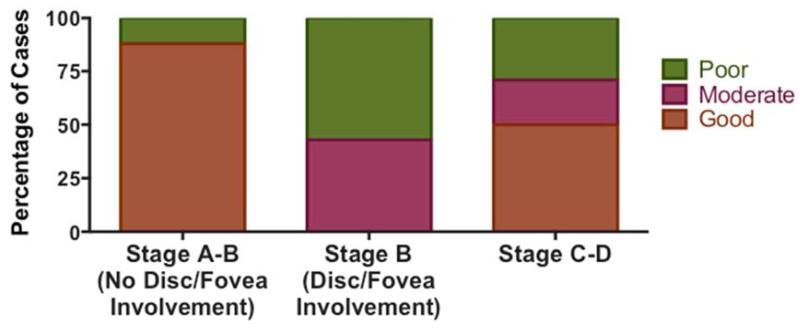
Figure 3.
Visual Outcomes. PRT-treated eyes with formal ophthalmologic evaluation were grouped by visual acuity into good (20/40 or better), moderate (20/40 to 20/600), or poor (worse than 20/600) outcome categories. The percentage of eyes in each category are shown for Stage A-B tumors without optic disc or fovea involvement, Stage B tumors with optic disc and/or fovea involvement, and Stage C-D tumors.

