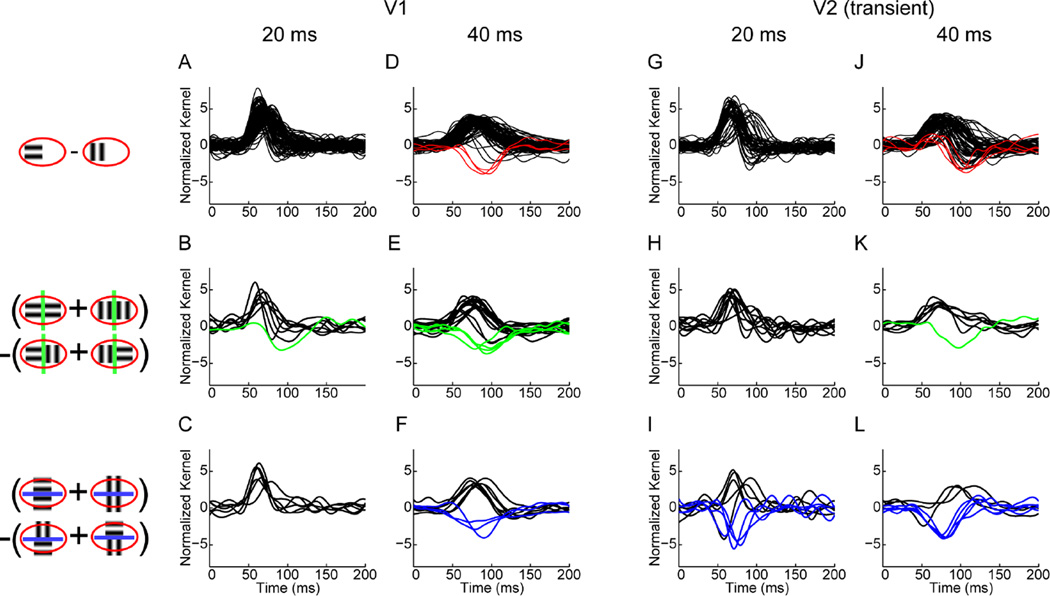
Figure 7. Responses of neurons to luminance and texture boundaries.
Icons on the left illustrate computation of first- and second-order kernels (see also Figure 6B). All responses are normalized and positive responses are plotted in black. Negative responses are plotted in red for first-order (luminance boundary) responses, in green for second-order (texture boundary) responses orthogonal to the receptive field and in blue for those parallel to the receptive field. (A) First-order kernels (B) second-order kernels orthogonal and (C) second-order kernels parallel to the receptive field for V1 neurons at 20 ms frame duration. (D) First-order kernels (E) second-order kernels orthogonal and (F) second-order kernels parallel to the receptive field for V1 neurons at 40 ms frame duration. (G) First-order kernels (H) second-order kernels orthogonal and (I) second-order kernels parallel to the receptive field for transient V2 neurons at 20 ms frame duration. (J) First-order kernels (K) second-order kernels orthogonal and (L) second-order kernels parallel to the receptive field for transient V2 neurons at 40 ms frame duration. Adapted from (Schmid et al., 2014).

