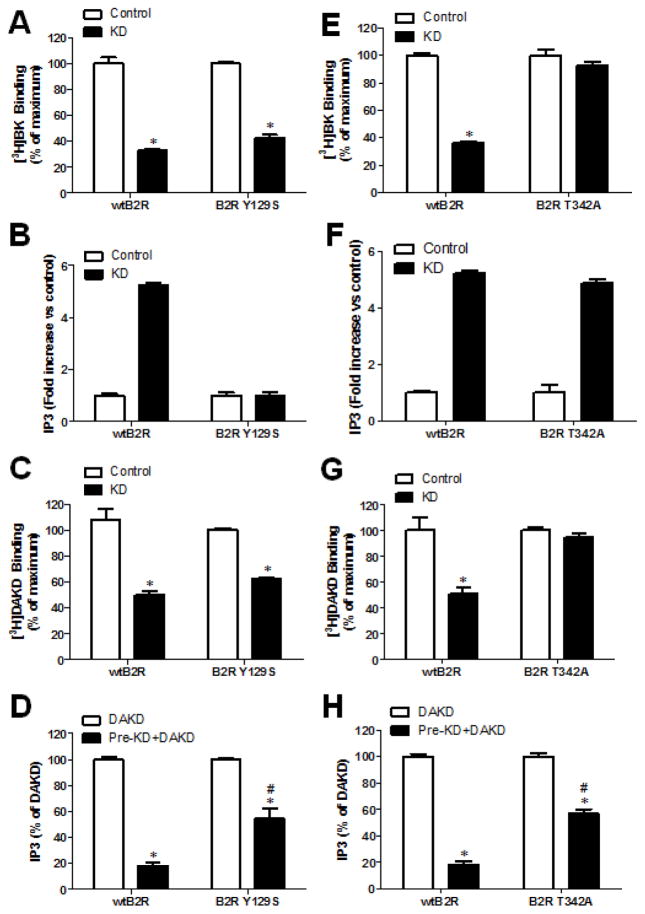
Figure 6. kB2R endocytosis and signaling are both required to downregulate kB1R signaling.
Experiments were conducted on HEK cells stably expressing kB1R and either wtkB2R, the signaling-defective mutant kB2R-Y129S (A–D) or the endocytosis-defective mutant kB2R-T342A (E–H). A, E. Cells were pretreated with kB2R agonist 1 μM KD for 10 min at 37 °C, and then [3H]BK binding to wtkB2R, kB2R-Y129S or kB2R-T342A on the cell surface were measured as described in Methods. The data were calculated as percent of total binding in cells not pre-treated with KD and are shown as mean ± SE (n=3). *p<0.05 vs Control (Student’s t test). B, F. Cells were incubated without (control) or with 1 μM KD for 30 min and IP3 production was determined as described in Methods. The fold-increase in IP3 over control is shown as mean ± SE (n=3). C, G. Cells were pretreated with kB2R agonist 1 μM KD for 10 min at 37 °C, and then cell surface [3H]DAKD binding to kB1R was determined as described in Methods. The data were calculated as percent of total binding in cells not pre-treated with KD and are shown as mean ± SE (n=3). *p<0.05 vs Control (Student’s t test). D, H. Cells were pretreated without or with 1 μM kB2R agonist KD, then incubated with 1 μM kB1R agonist DAKD for 30 min and the IP3 generation was determined. The IP3 production due to kB1R was calculated as total IP3 from the cells stimulated with KD and DAKD, minus IP3 generation from the cells treated only with KD. The data are shown as percent of IP3 generated in cells after stimulation with DAKD alone and shown as mean ± SE (n=3). *p<0.05 vs DAKD; #p<0.05 vs wtkB2R (Student’s t test).

