
Figure 1.
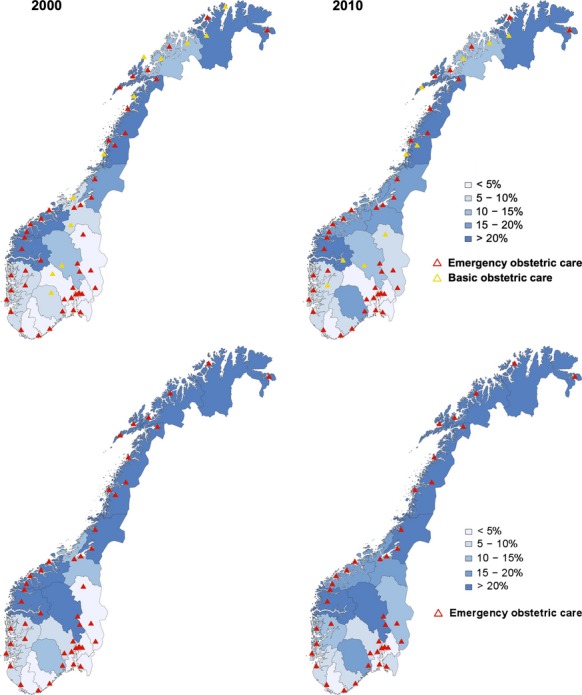
Travel time to all institutions and emergency obstetric care institutions. The proportion of women living outside the 1-hour zone in the 19 counties on 1 January 2000 and 2010 (%) is shown in the background colour scale for all institutions (top) and emergency obstetric care institutions (bottom). The institutions are marked according to the level of care. Based on census data from Statistics Norway and the Norwegian road database.