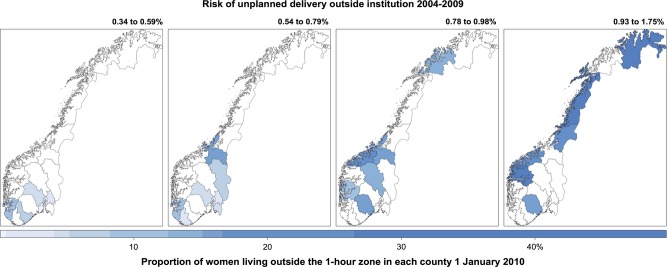
Figure 2.

Risk of unplanned delivery outside institutions and travel time to institutions. The counties were sorted into four levels of risk based on the period 2004–09. The colour scale shows the proportion of women living outside the 1-hour zone in each county (%) on 1 January 2010. Based on data from the Medical Birth Registry of Norway, and on census data from Statistics Norway combined with the Norwegian road database.
