
Figure 3.
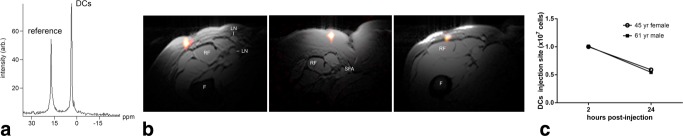
In vivo MRI in patients following intradermal DC administration into quadriceps. In these patients, approximately 1 × 10⁷ labeled cells were injected. a: shows a representative 19F MRS spectrum of patient at 4 h postinoculation. The DCs appear as a single narrow peak. “Reference” is from an external tube containing TFA placed alongside the patient. b: Axial composite 19F/1H images of the right thigh at 4 h postinoculation in three patients, a 53-year-old female (left), a 45-year-old female (middle) and a 61-year-old male (right), where the DCs are rendered in “hot-iron” pseudocolor and the 1H anatomy is displayed in grayscale (F = femur, RF = rectus femoris, SFA = superficial femoral artery, LN = inguinal lymph node). c: The results of the in vivo quantification of apparent cell numbers using the 19F MRI data, measured in two patients. By ∼24 h postinoculation, roughly half of the injected DCs were still present at the injection site.