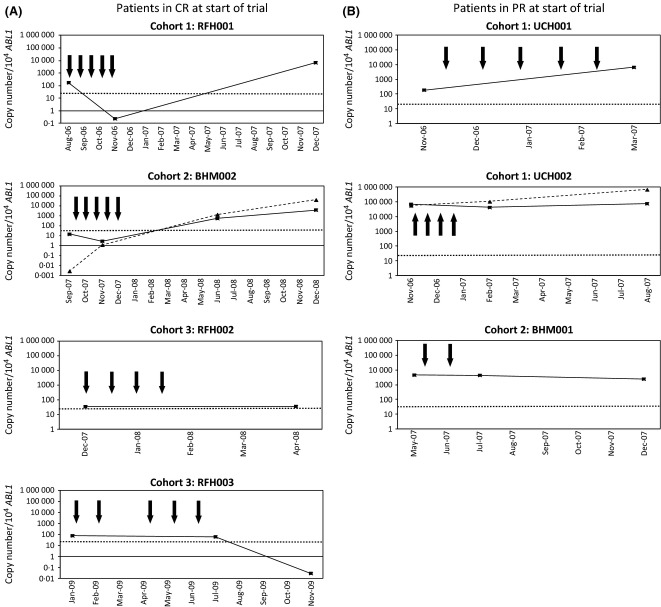
Fig 3.
Disease response to vaccination with pWT126, pWT235 and PADRE peptides as measured by WT1/ABL1 mRNA quantification. Results are shown for individual patients in complete remission (CR) (A) or partial remission (PR) (B) at the start of the trial. Expression of WT1 mRNA (solid, black squares) and, in patients with mutations in NPM1, NPM1 mutant mRNA (dashed, triangles) are shown as a ratio of the gene of interest to ABL1. Months from the start of trial are shown on the X axis. Bold arrows denote times of vaccination and the time at which maximal tetramer responses were detected are given in the results section. The horizontal dotted line corresponds to the upper limit of WT1 expression in normal peripheral blood, as previously defined (Cilloni et al, 2009). RFH, Royal Free Hospital, London; UCH, University College Hospital, London; BHM, Queen Elizabeth Hospital, Birmingham.

