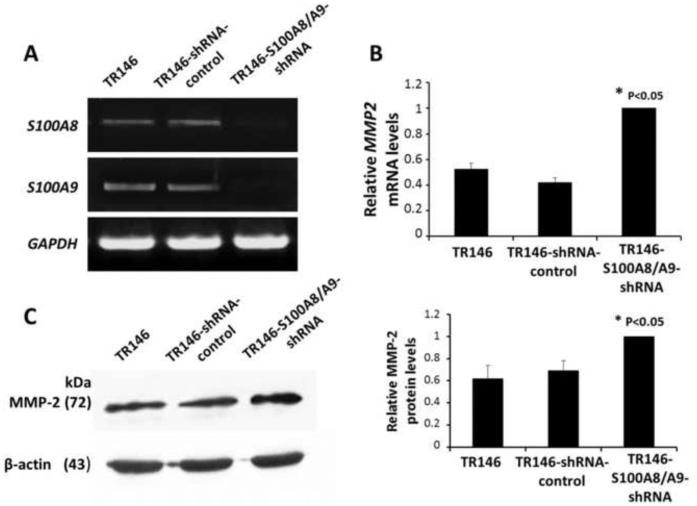
Figure 3. Endogenous expression of MMP2 in TR146 cells.
(A) Confirmation of knockdown of endogenous S100A8 and S100A9 in TR146 cells using PCR analysis. (B) MMP2 mRNA levels in TR146, TR146-shRNA-control, TR146-S100A8/A9-shRNA cell lines determined using quantitative RT-PCR. All mRNA values were normalized to GAPDH, a housekeeping gene, and expressed relative to TR146 control cells. (C) Levels of MMP-2 protein in TR146, TR146-shRNA-control, and TR146-S100A8/A9-shRNA cells as determined using Western blots. Protein levels were normalized to β-actin and expressed relative to TR146 cells. Assays were performed in triplicate and repeated three times. The protein and mRNA levels were analyzed by one-way ANOVA and statistical differences between the cell lines were reported (P < 0.05).

