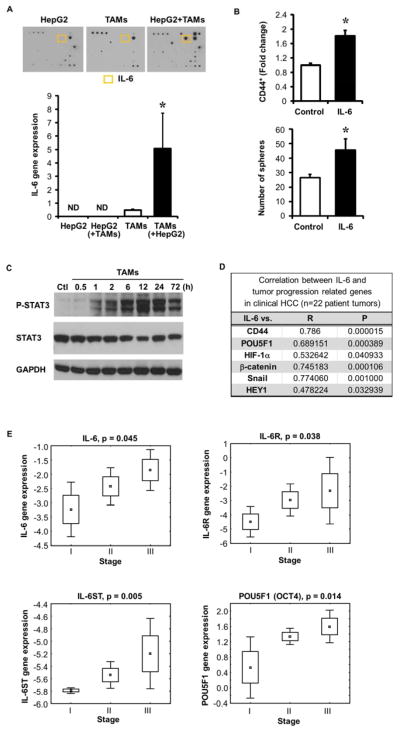
Figure 4. TAM secreted IL-6 promotes CSC expansion in HCC.
(A) HepG2/TAMs transwell co-culture supernatants underwent cytokine antibody array (top, representative one of three experiments) while cells underwent evaluation for IL-6 by qRT-PCR and compared to HepG2 or TAMs alone (bottom, mean±SEM of relative gene expression, *p<0.05 vs. TAMs alone, n=3 experiments). IL-6 protein is highlighted in yellow. Cell type assessed indicated by ( ). ND is non-detectable.
(B) CD44+ cell enrichment and sphere forming capacity following three day IL-6 culture (10 ng/mL). CD44 determined by FACS and sphere formation determined at 2 weeks (n=3, *p<0.05 vs. vehicle control).
(C) Western blotting demonstrating increased phosphorylated STAT3 (P-STAT3) following exposure of HepG2 cells to TAMs vs. without TAMs (Ctl). One of three representative experiments is shown.
(D) Correlation of IL-6 with CD44 and other stem cell-related gene expression in clinical HCC tumors as determined by qRT-PCR (n=22 patients). Spearman rank order correlation co-efficient (R) and P-value (P) were determined.
(E) Correlation of IL-6, IL-6 receptors (IL-6R and IL-6ST), and stemness-related gene POU5F1 to HCC clinical stage using a microarray database22 (p<0.05) (n=60 patients). Spearman rank order P-value (p) was determined.

