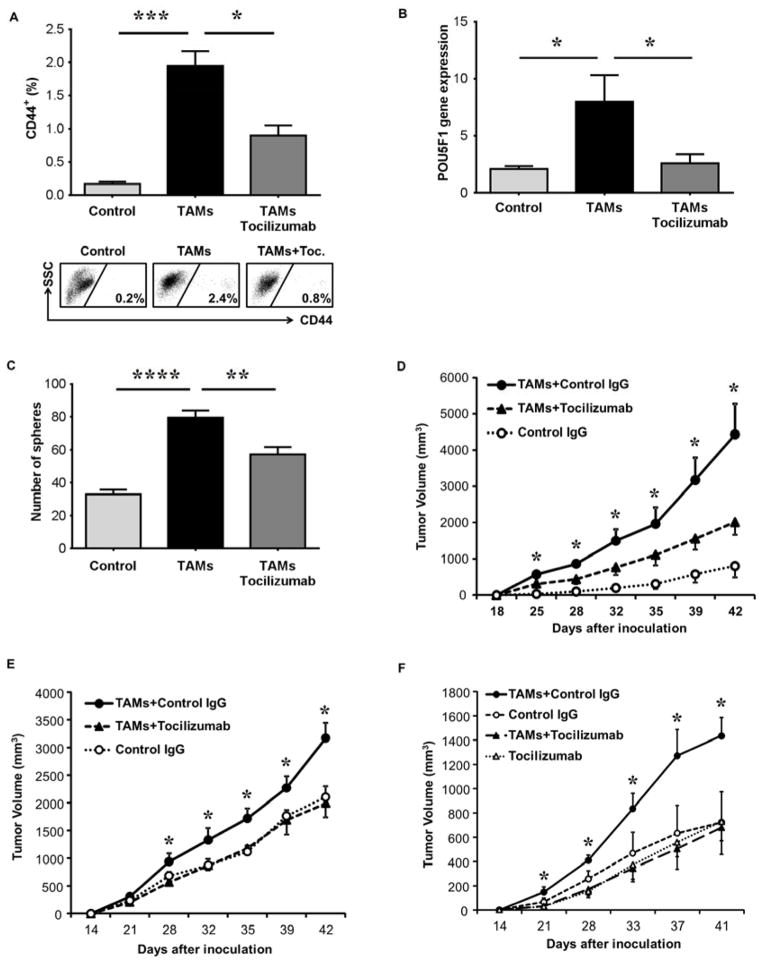
Figure 6. Tocilizumab blocks TAM promotion of HCC tumor growth and stemness expansion in vivo.
(A) HepG2 cells were injected IP into NSG mice and six weeks later TAMs were injected IP (30 million cells) and three days later tumor nodules underwent FACS for CD44. Tocilizumab was administered (20 mg/kg IP) at time of TAM injection (n=5 mice per group, one of two representative experiments is shown and representative FACS.
(B) HepG2 and TAMs were injected IP into NSG mice as in (A) and tumor nodules underwent qRT-PCR for POU5F1 expression.
(C) Sphere assay was performed (1000 cells per group) on tumor nodule cells following experiment as described in (A), (n=5).
(D) Peritoneal tumors from (A) underwent single cell suspension and were injected subcutaneously (1000 cells/group) into NSG mice. Tumor volume was measured (n=5 mice/group). One of two representative experiments is shown.
(E) HepG2 cells, following co-culture (1000 cells) without or with TAMs and human IgG control antibody or TAMs and Tocilizumab (5μg/ml), were injected subcutaneously into NSG mice. Tumor volume was measured (n=4 mice). One of three independent experiments is shown.
(F) Tocilizumab blockade of TAM-induced tumor growth in vivo following flank co-implantation of HepG2 (5000 cells) and TAMs (10,000 cells) in matrigel into NSG mice. Tocilizumab (20 mg/kg IP every week) or IgG isotype control antibody was administered and tumor volume was measured (n=5 mice/group). One of two representative experiments is shown.
*p < 0.05, **p < 0.01, ****p < 0.0001. Data presented as mean±SEM.

