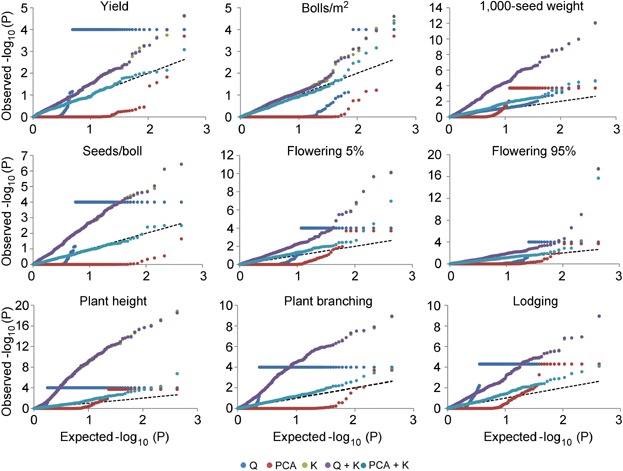
Figure 1.

Probability-probability (P-P) plots of observed versus expected −log10 (P) values for nine agronomic traits evaluated with five association mapping modelsQ general linear model using the Q matrix, PCA general linear model using the principal component analysis matrix, K mixed linear model using the kinship matrix, Q + K mixed linear model using the Q and K matrices, PCA + K mixed linear model using the PCA and K matrices.
