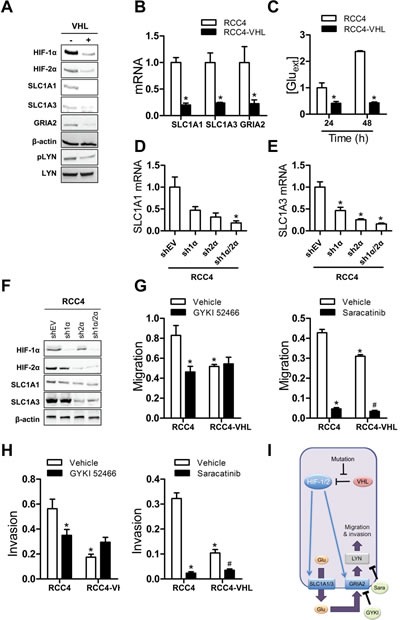
Figure 6. HIF-mediated glutamate signaling in RCC4 cells.

(A-B) Immunoblot (A) and RT-qPCR (B) assays of RCC4 (-) and RCC4-VHL (+) cells were performed. *P < 0.05 vs RCC4, Student's t test. (C) Glutamate concentrations were measured in conditioned media, and normalized to RCC4 at 24 h.*P < 0.05 vs RCC4 at 24 h and at 48 h, Student's t test. (D-F) RT-qPCR (D, E) and immunoblot (F) assays were performed with RCC4 subclones. *P < 0.05 vs shEV, ANOVA with Bonferroni post-test. (G) Cells were seeded in a Boyden chamber in the presence of vehicle, GYKI 52466 (left panel), or Saracatinib (right panel) and migration through uncoated inserts in response to FBS was determined by crystal violet staining. *P < 0.05 vs RCC4-vehicle, #P < 0.05 vs RCC4-VHL-vehicle. (H) Cells were seeded on Matrigel-coated inserts in the presence of vehicle, GYKI 52466 (left panel), or 10 μM Saracatinib (right panel). Cells that invaded through the coated inserts were determined by crystal violet staining. *P < 0.05 vs RCC4-vehicle; #P < 0.05 vs RCC4-VHL-vehicle. (I) The mechanisms and consequences of HIF-mediated glutamate signaling in RCC4 cells are shown. Data are mean ± SEM or a representative blot from ≥ 3 experiments.
