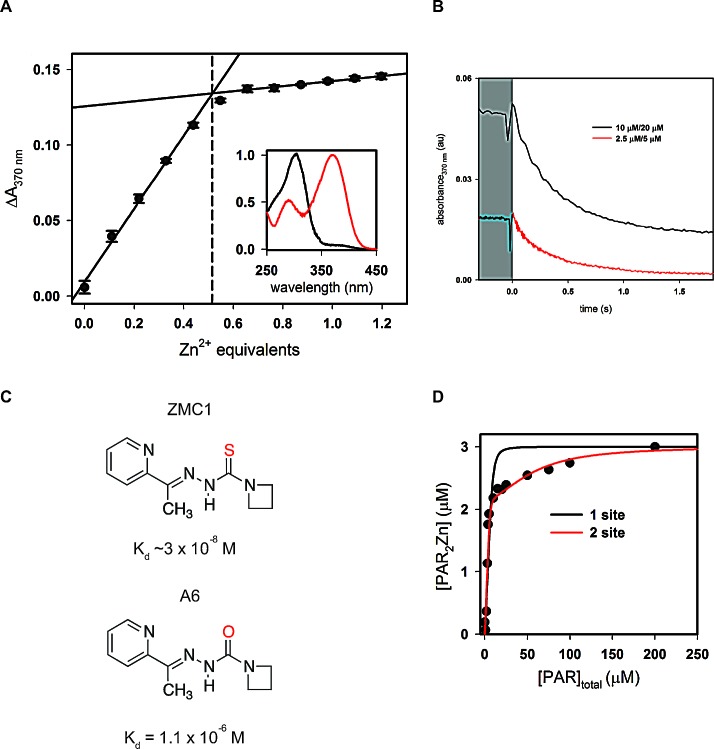
Figure 1. Binding interactions of ZMC1, DBD, and zinc.
A, titration of ZMC1 and ZnCl2. Extrapolation of the linear phases shows 0.51 ± 0.01 equivalents of Zn2+ at saturation. Inset shows normalized absorbance spectra for ZMC1 alone (black) and ZMC1-Zinc complex (red). B, measurement of ZMC1-zinc complex dissociation rate. Solutions of ZnCl2 and ZMC1 were mixed 1:1 with 2 mM EDTA to the final concentrations indicated (written ZnCl2/ZMC1). The traces are an average of 3-4 injections and when fit to a single exponential, yield nearly identical rates, which we combine to report a koff of 2.6 ± 0.1 s−1. C, structures of ZMC1 and A6 and their Kd's for Zn2+. D, determination of the Kd of R175H DBD for Zn2+.R175H DBD (5 μM, 0.6 equivalents Zn2+ co-purified) was incubated with increasing concentrations of PAR to compete for the available Zn2+. The concentration of PAR2Zn2+ complex was determined by absorbance, and the parallel mass action and mass conservation equations solved to determine Kd. Kd's from the 2-site model are 2.1 ± 0.8 nM for the tighter site (Kd1) and below the detectable limit for the weaker site (Kd2), respectively.

