
Figure 5. Targeting MUC1-C induces MET.
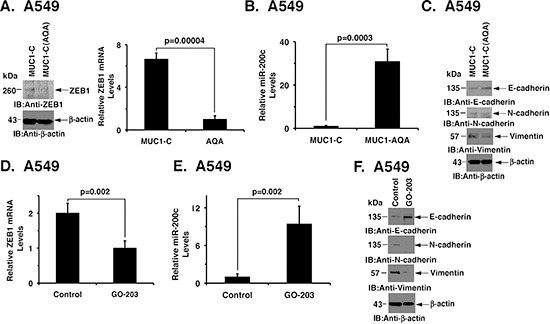
(A) Lysates from A549/MUC1-C and A549/MUC1-C(AQA) cells were immunoblotted with the indicated antibodies (left). ZEB1 mRNA levels were determined by qRT-PCR. The results are expressed as relative ZEB1 mRNA levels (mean±SD of three determinations) as compared to that obtained for GAPDH as a control (right). (B) miR-200c levels in A549/MUC1-C and A549/MUC1-C(AQA) cells were determined by qRT-PCR. The results are expressed as relative miR-200c levels (mean±SD of three determinations) as compared to that obtained for U6 as a control. (C) Lysates from A549/MUC1-C and A549/MUC1-C(AQA) were immunoblotted with the indicated antibodies. (D) A549 cells were left untreated or treated with 5 μM GO-203 for 48 h. ZEB1 mRNA levels were determined by qRT-PCR. The results are expressed as relative ZEB1 mRNA levels (mean±SD of three determinations) as compared to that obtained for GAPDH as a control. (E) A549 cells were left untreated or treated with 5 μM GO-203 for 48 h. Relative miR-200c levels were determined by qRT-PCR. The results are expressed as relative miR-200c levels (mean±SD of three determinations) as compared to that obtained for U6 as a control. (F) A549 cells were left untreated or treated with 5 μM GO-203 for 48 h. Lysates were immunoblotted with the indicated antibodies.