
Figure 1. The most frequent alterations in representative HNSCC-derived cells.
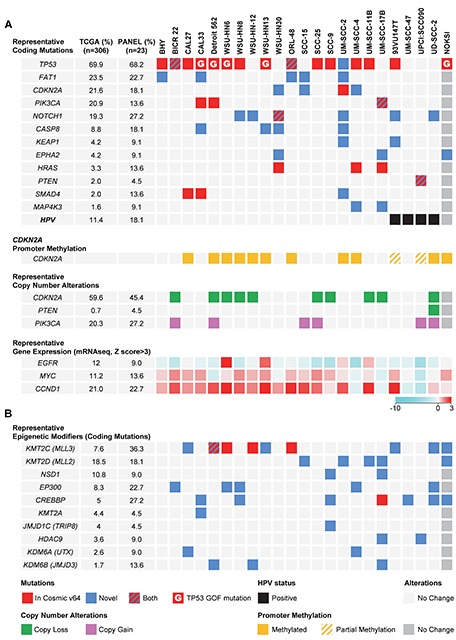
(A) Top panel, graphical matrix representation of the individual mutations in 22 HNSCC cells and a normal spontaneously immortalized oral keratinocyte line (NOKSI, dark grey to denote the exclusion from the OPC-22 panel). Individual genes are represented in rows and cell lines in columns. In some cases more than one mutation per gene is present. For a comprehensive list see Supplemental Data File 1. The HPV status of each HNSCC-derived cell is represented in the bottom row. Second panel, PCR based promoter methylation analysis of the CDKN2A gene. Third panel, representative per-gene copy number variations as derived from comparison of each cell line to a computed pseudo-normal. Fourth panel, representative gene expression levels as determined by RNAseq data. Color code represents a log2 transformed fold expression normalized to the median of all samples. (B) Mutations in genes encoding histone modifying enzymes. Red square, mutation described in the COSMIC v64 database. Blue square, novel mutation. Red/Blue square, two or more mutations in a gene, one being novel and the other present on the COSMIC v64 database. Red square with inlay G, TP53 mutation present in the COSMIC v64 database defined as Gain-Of-Function. Green square, Gene copy loss, representing both hetero and homozygous deletions. Pink square, Gene copy gain, representing both copy gain and gene amplification. Black square, HPV status. Yellow square, CDKN2A promoter region methylation, no unmethylated product was detected. Yellow/Gray, CDKN2A promoter methylation analysis detected both methylated and unmethylated products. Light and dark grey squares, no change.