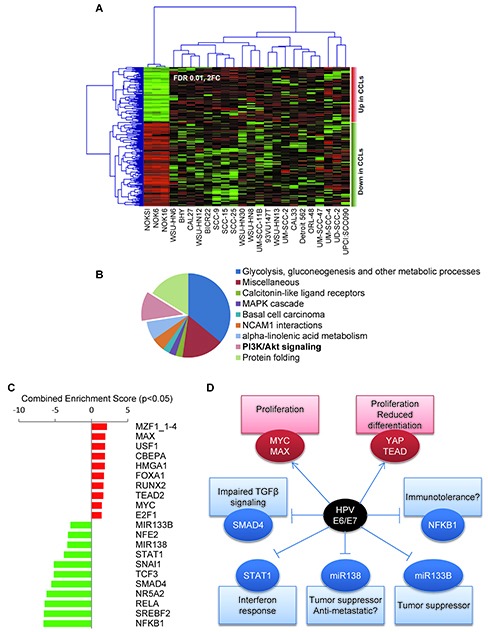
Figure 4. Gene expression analysis of the OPC-22 panel.

(A) Supervised clustering analysis of the OPC-22 HNSCC lines on differentially expressed genes (FDR<0.01, Fold change ≥2) when comparing HNSSC lines to normal. Two additional normal cells lines (NOK6 and NOK16) represent two additional independent isolates from the same donor and were included in this analysis for statistical purposes. UM-SCC-17B was removed from the analysis due to outlier expression profile. (B) Functional enrichment analysis on biological processes on differentially expressed genes using the ClueGO tool. (C) Genes differentially expressed between HPV+ and HPV- groups (Moderated T-test, p<0.05, fold change >±2) were analyzed by the Enrichr tool against the TRANSFAC and JASPAR position weight matrices (PWMs) for predicted transcription binding sites in their respective promoter regions. The combined score is a positive value computed by taking the log of the p-value from the Fisher's exact test and multiplying that by the z-score of the deviation from the expected rank. Enrichment scores derived from the downregulated gene list were given negative value for representation purposes. (D) Schematic representation of a hypothetical HPV E6/E7 interaction network leading to differential gene expression in the OPC-22 HPV+ cohort.
