
Figure 2. The MEF cell proliferation plots with 5 day time-trace and to gradient dosages of FCDR and Decitabine.
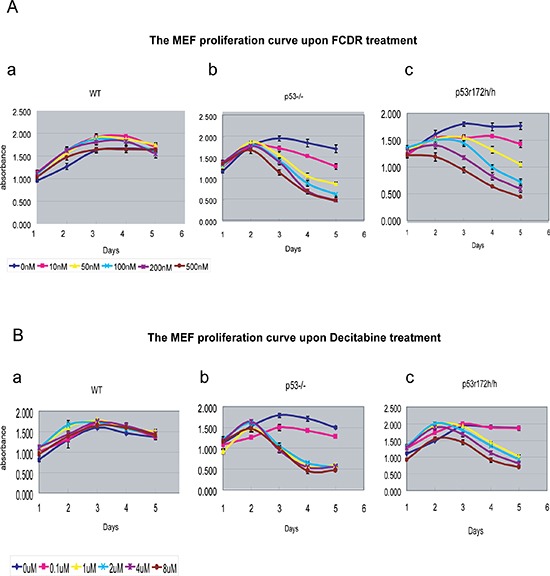
(A) The live cell proliferation curve with time upon series dosage of FCDR treatment in wildtype(a), p53KO(b) and p53r172h(c) MEFs. 0nM(dark blue), 10nM(light purple), 50nM(yellow), 100nM(light blue), 200nM(dark purple), 500nM(brown). (B) The live cell proliferation curve with time upon series dosage of decitabine treatment in wildtype(a), p53KO(b) and p53r172h(c) MEFs. 0μM(dark blue), 0.1μM(light purple), 1μM(yellow), 2μM(light blue), 4μM(dark purple), 8μM(brown).