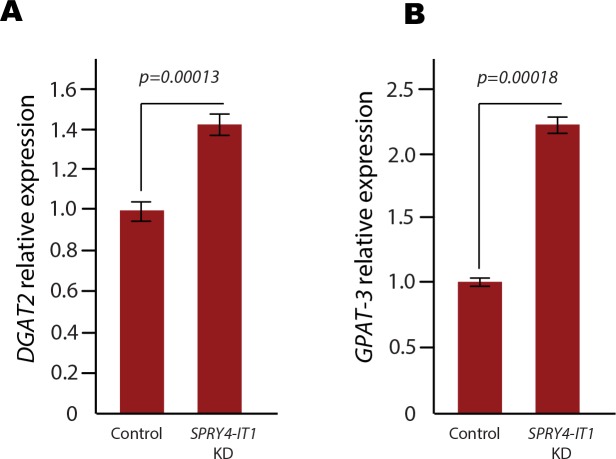
Figure 5. Expression of Diacylglycerol O-acyltransferase 2 and (DGAT2) Acyl-coA:glycerol-3-phosphate Acyltransferase 3 (GPAT3) Following SPRY4-IT1 Knockdown.
Both DGAT2 (A) and GPAT3 (B) mRNA levels are increased upon knockdown of SPRY4-IT1 in A375 cells, which may explain the decrease in DAG levels and increase in TAG levels observed in these cells (Table S2).

