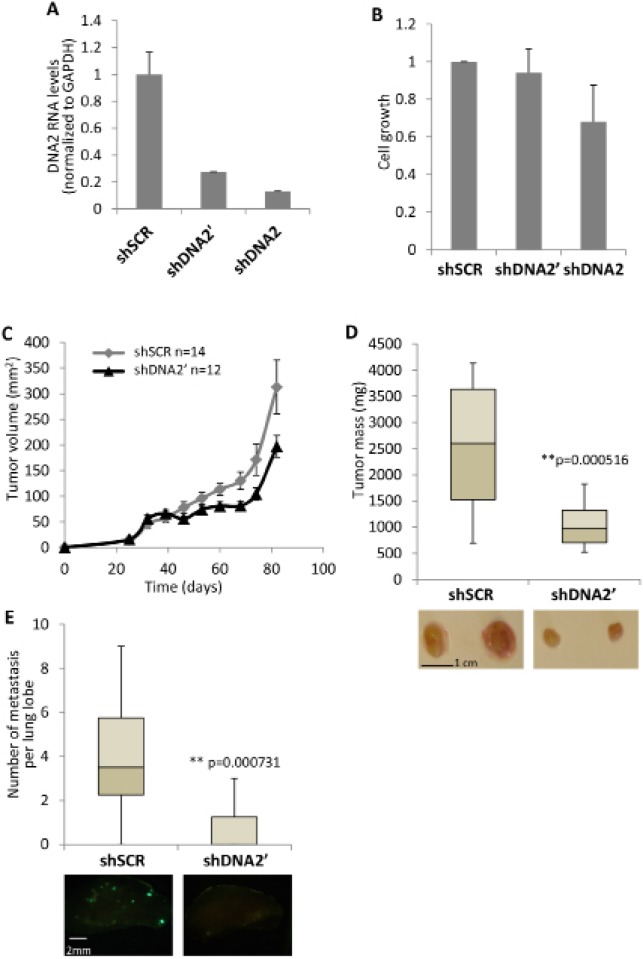
Figure 3. Downregulation of DNA2 results in slower cell and tumor growth.
(A, B) MDA-MB-435 cells were infected with two shRNAs directed against DNA2 (shDNA2 and shDNA2′) or with a control shRNA (shSCR). Downregulation of DNA2 expression was analyzed by real-time PCR (A). cells were plated at equal numbers in a 6-well plate. 5 days later, cells were fixed and cellular growth was tested (B). (C) MDA-MB-435/GFP cells, down-regulated for DNA2 or control, were injected to female mice mammary fat pad. 106 cells were used for each injection (day 0). From day 25 and forward, tumors were measured and tumor volume was calculated approximately every 7 days. (D) 82 days after the injection mice were sacrificed and the tumors were taken out and weighed. Below, pictures of representative tumors from the different treatments. (E) lungs were harvested from the mice described in D. The large lobe from every lung was analysed from both sides for metastases by florescent microscopy. Lumps above the size 100 μm2 were counted. Below, pictures of representative lobes from the different treatments. The whiskers in the box plots represent the minimum and maximum values of all data (D and E).

