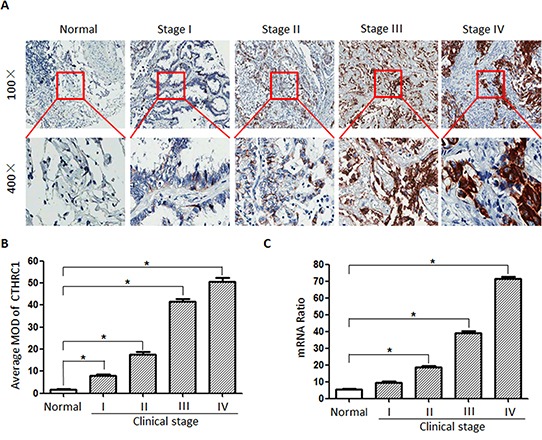
Figure 6. CTHRC1 protein and mRNA overexpression characteristics in archived paraffin-embedded NSCLC tissues from different clinical stages.

(A) CTHRC1 staining intensity gradually increased in accordance with the clinical stages from I to IV by IHC. Representative images from IHC analyses of CTHRC1 expression in normal lung tissues and primary NSCLC tissues. (B) Statistical analyses for the average MOD of CTHRC1 staining between normal lung tissues (72 cases) and NSCLC tissues of different clinical stages (*p<0.05). (C) CTHRC1 mRNA expression levels between normal lung tissues (72 cases) and NSCLC tissues of different clinical stages (*p<0.05).
