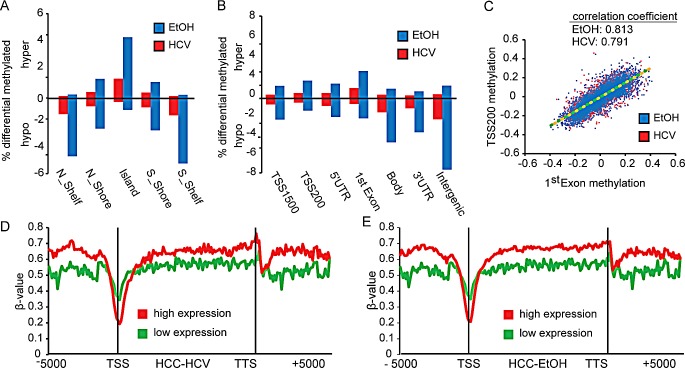
Figure 4. Distribution of DNA methylation changes across genomic features.
Bar charts depicting the relative percentage of DNA methylation changes at CpG islands (A) and intragenic (B) features (Δβ>0.25, FDR<0.05). Graphs above the x-axis depict hypermethylation, with hypomethylation events below. C. Dot plot showing the association between changes in TSS200 methylation and 1st Exon regions in HCC-HCV (red) and HCC-EtOH (blue) relative to normal liver. Trend lines are shown for HCC-HCV (green dashed line) and HCC-EtOH (orange dashed line). Correlation coefficients are shown. DNA methylation β-values across genes including 5,000 base pairs flanking the transcription start site (TSS) and transcription termination site (TTS) of the gene for HCC-HCV (D) and HCC-EtOH (E) based upon highly expressed (red) and lowly expressed (green) genes defined from analysis of normal liver.

