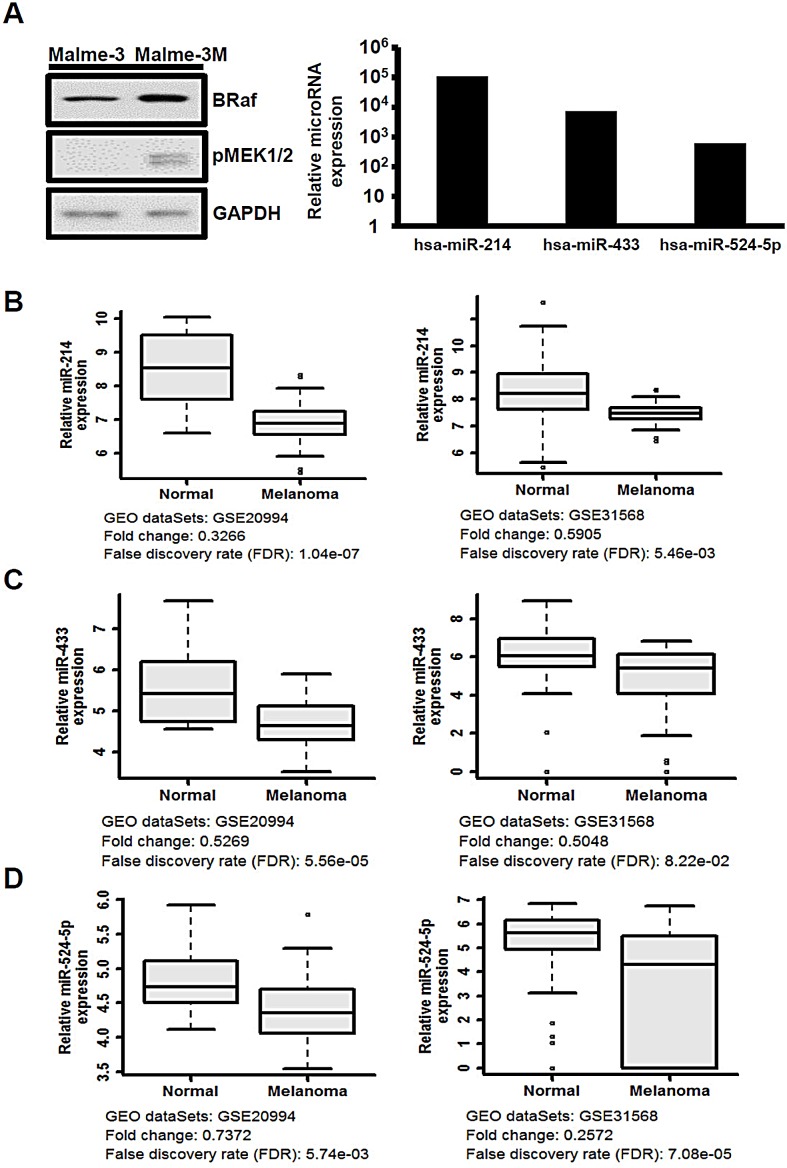
Figure 1. The expression of miR-214, miR-433, and miR-524-5p is suppressed in melanoma.
(A) Left panel, MAPK/ERK signaling was highly activated in the Malme-3M cell line according to Western analysis to detect the protein levels of BRAF and phospho-MEK. Right panel, the relative expression levels of miR-214, miR-433, and miR-524-5p were detected by the TaqMan miRNA expression array (normalized to RNU44 and RNU48) with the ratio of Malme-3 to Malme-3M. (B-D) Box-whisker plots of miR-214, miR-433, and miR-524-5p in melanoma samples. The miRNA expression profiles were obtained from the Gene Expression Omnibus (GEO) accession numbers GSE20994 and GSE31568. We downloaded raw data and used statistical analysis to obtain the mean and FDR values. The fold change was evaluated from the mean of melanoma samples versus normal.

