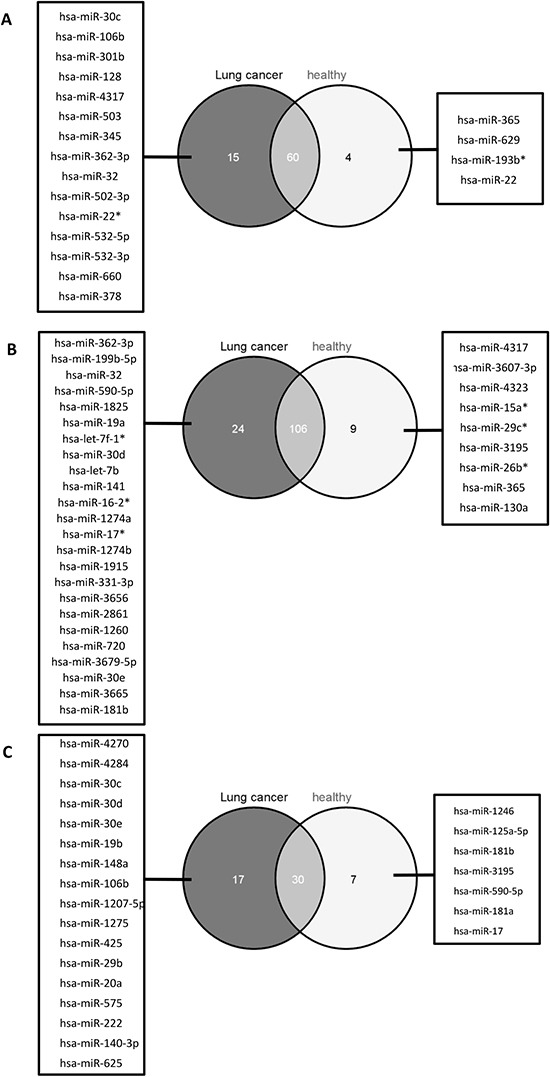
Figure 3. Venn diagram with the miRNAs indicative for blood cell origin, line of defense, and function.

We identified the miRNAs deregulated between cells with common myelod progenitor and common lyphoid progenitor (A), cells of the innate immune system and the adaptive immune system (B), as well as antigen presenting cells and cytotoxic cells (C) for lung cancer patients (dark grey circles) and healthy individuals (light gray circles), respectively. The miRNAs specific in the comparisons for lung cancer sapmles are listed in the boxes on the left, miRNAs specific in the comparisons for healthy individuals are listed in the boxes on the right. The number of miRNAs that were deregulated in lung cancer samples and healthy individuals are indicated by the overlap of the circles.
