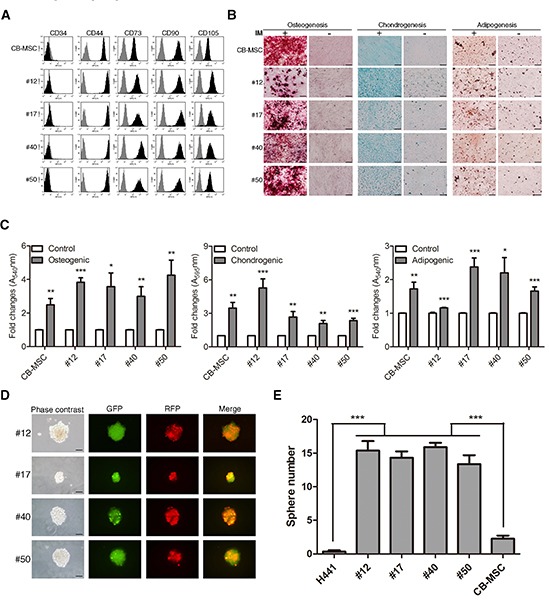
Figure 4. Fusion progeny display stem cell properties similar to MSCs.

(A) Cell-surface marker profiles of fusion and parent MSC cells determined by flow cytometry using antibodies against indicated antigens; grey regions represent isotype controls. (B) Multilineage differentiation capacity of fusion progeny and parental MSCs. Osteogenic differentiation was assessed by Alizarin Red S staining for mineral nodule deposition. Chondrogenic differentiation was assessed by Alcian blue staining for proteoglycan deposition. Adipogenic differentiation was assessed by Oil Red O staining for lipid vesicle formation. IM: induction medium. (C) Quantitation of multilineage differentiation of fusion progeny and parental MSCs from three independent experiments. Values are means + SEM; *, P<0.05; **, P<0.01; ***, P<0.001 in unpaired t-tests with Welch's correction. (D) Representative phase-contrast and fluorescence images and (E) quantitation of spheres formed by fusion progeny; scale bars indicate 200 μm. Values are means + SEM; *** indicates P<0.001 in unpaired t test with Welch's correction, compared to H441 or CB-MSC parent cells.
