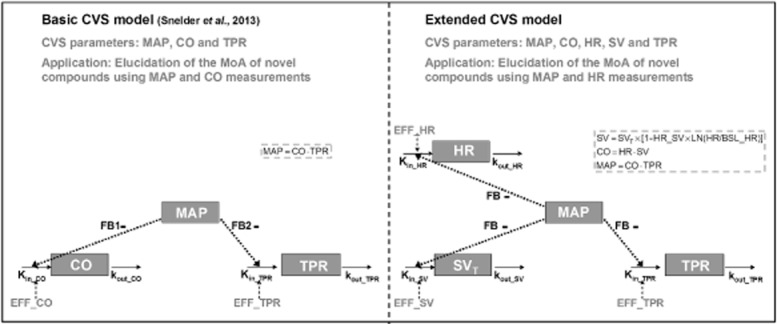
Figure 1.

Comparison between the basic CVS model to characterize drug effects on the interrelationship between MAP, CO and TPR and the extended CVS model to characterize drug effects on the interrelationship between MAP, CO, HR, SV and TPR. Extended CVS model: CO equals the product of HR and SV (CO = HR × SV) and MAP equals the product of CO and TPR (MAP = CO × TPR). SV is influenced by indirect feedback through MAP (SVT) and by HR through a direct inverse log-linear relationship, where HR_SV represents the magnitude of this direct effect. Effects on HR, SV and TPR are described by three linked turnover equations. In these equations, Kin_HR, Kin_SV and Kin_TPR represent the zero-order production rate constants and kout_HR, kout_SV and kout_TPR represent the first-order dissipation rate constants. When MAP increases as a result of a stimulating effect on HR, SV or TPR, the values of HR, SV and TPR will decrease as a result of the action of the different feedback mechanisms regulating the CVS. In this model, the magnitude of feedback on HR, SV and TPR is represented by FB. System-specific parameters are indicated in blue and drug-specific parameters are indicated in red.
