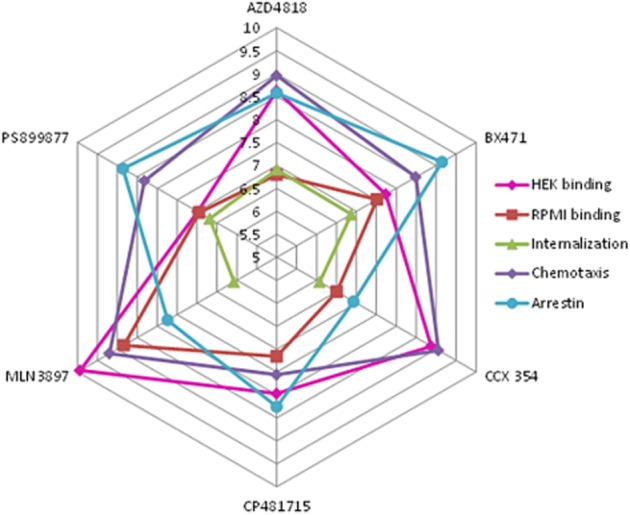
Figure 5.

Radar plot for CCR1 antagonists. A radar plot of the six CCR1 antagonists and their pIC50 values for (i) displacement of [125I]-CCL3 binding to HEK membrane; (ii) displacement of 125I-CCL3 binding to RPMI 8226 membrane; (ii) CCL3-mediated internalization of CCR1 in RPMI 8226 cells; (iv) CCL3-mediated chemotaxis of RPMI 8226 cells; and as well as (v) pKB values for β-arrestin translocation. For statistical analysis, see Tables 2 and 3.
