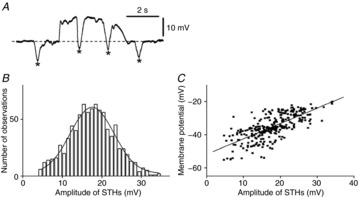
Figure 4. Properties of STHs recorded from fibroblast-like cells of rabbit small intestine.

A, a train of STHs superimposed upon a slow wave depolarization recorded from a fibroblast-like cell. The asterisks indicate individual STHs in the trace. Note that STHs occurred during and between slow wave depolarizations. B, amplitude histogram of STHs recorded from fibroblast-like cells. The curve is a Gaussian distribution, with a mean of 17.5 mV and standard deviation of 0.2 mV. C, relationship between the amplitude of STHs and membrane potential just prior to the generation of STHs. The regression line is given by y = 0.73x – 51.8 (r = 0.63; n = 869 from 8 preparations, P < 0.001).
