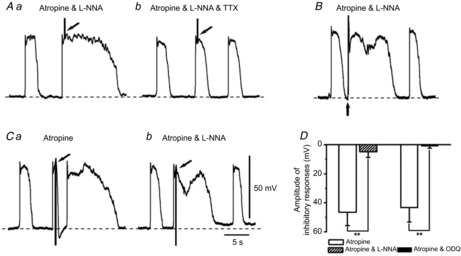
Figure 10. Properties of junction potentials evoked by electrical field stimulation recorded from ICC-MY of rabbit small intestine.

A, EFS was applied at the peak of slow wavesICC in the presence of atropine (3 μm) and L-NNA (100 μm) (Aa) and after application of 1 μm TTX (Ab). B, EFS was applied during the intervals between slow wavesICC in the presence of atropine (3 μm) and L-NNA (100 μm). C, IJPs were evoked at the peak of slow wavesICC before (Ca) and after application of 100 μm L-NNA (Cb). Atropine (3 μm) was present throughout. D, summary of the effects of L-NNA (100 μm) or ODQ (10 μm) on IJPs evoked at the peak of slow wavesICC recorded from ICC-MY in the presence of atropine. Scale bars on the electrical traces in C apply to all traces. The resting membrane potentials were: A, −66 mV; B, −65 mV; C, −64 mV. A, B and C were recorded from different tissues. Data are means ± SD. **P < 0.01, significant difference from control.
