
Figure 5. eNOS (A), iNOS (B) and nNOS (C) expression from medial gastrocnemius (MG; white), lateral gastrocnemius (LG; light grey) and soleus (Sol; dark grey) muscles in sedentary (S) and exercise trained (Ex) groups. NOS expression was normalized to α-tubulin protein levels.
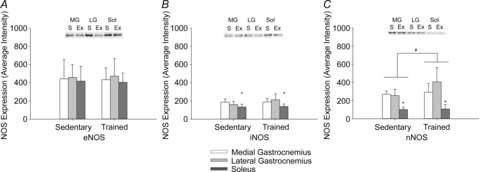
Values and means ± s.d. Significant difference between #groups (main effect) and *muscles (main effect). P < 0.05 was considered statistically significant. eNOS, endothelial nitric oxide synthase; Ex, exercise-trained; iNOS, inducible nitric oxide synthase; LG, lateral gastrocnemius; MG, medial gastrocnemius; nNOS, neuronal nitric oxide synthase; S, sedentary; Sol, soleus.