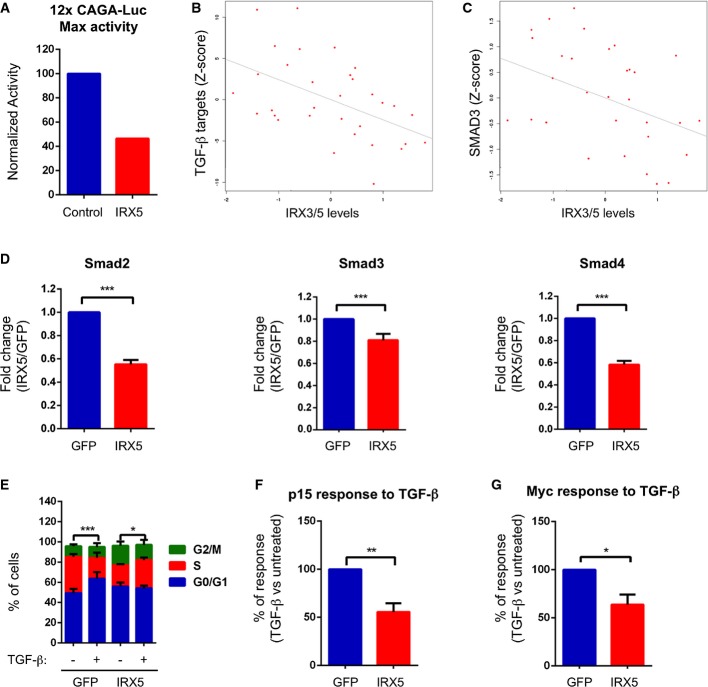
Figure 3. Irx3 and Irx5 regulate the response to TGF-β in human cells.
A Graph of a representative experiment showing maximum luciferase activity upon TGF-β treatment of cells transfected with an empty vector or the Irx5-expressing vector.
B Negative correlation between TGF-β targets and IRX3/IRX5 expression in the cohort of adenoma samples from the GSE8671 dataset (Spearman’s correlation = −0.47507, P-value = 0.0065275, n = 32).
C Negative correlation between SMAD3 and IRX3/IRX5 expression in the same dataset as in (B) (Spearman’s correlation = −0.43218, P-value = 0.014199).
D qRT–PCRs of Smad2, Smad3, and Smad4 in LSTBRII cells expressing GFP or IRX5. Cells were induced with doxycycline for 24 h, and the levels of Smad2, Smad3, and Smad4 were assessed by qRT–PCR. Data are presented as mean fold change over GFP cells ± SEM (n = 4) (***P-value < 0.001, two-tailed t-test).
E Cell cycle profile of LSTBRII cells expressing GFP or IRX5 in response to TGF-β. Cells were induced with doxycycline and treated with TGF-β for 72 h. Data are presented as % of cells in G0/G1, S, or G2/M from the total population ± SEM (n = 6) (***P-value < 0.001; *P-value < 0.05, two-way ANOVA). Comparisons refer to cells in S phase.
F, G p15/Cdkn2b (F) or cMyc (G) response to TGF-β treatment of LSTBRII cells expressing GFP or IRX5. Cells were induced with doxycycline for 24 h and then treated with TGF-β for an additional 24 h. Results are expressed considering the transcriptional upregulation of p15/Cdkn2b (F) or the transcriptional downregulation of cMyc (G) of GFP cells (+TGF-β versus –TGF-β) as 100%. Data are presented as mean % of response ± SEM (n = 4) (*P-value < 0.05, **P-value < 0.01, two-tailed t-test).
Source data are available online for this figure.

