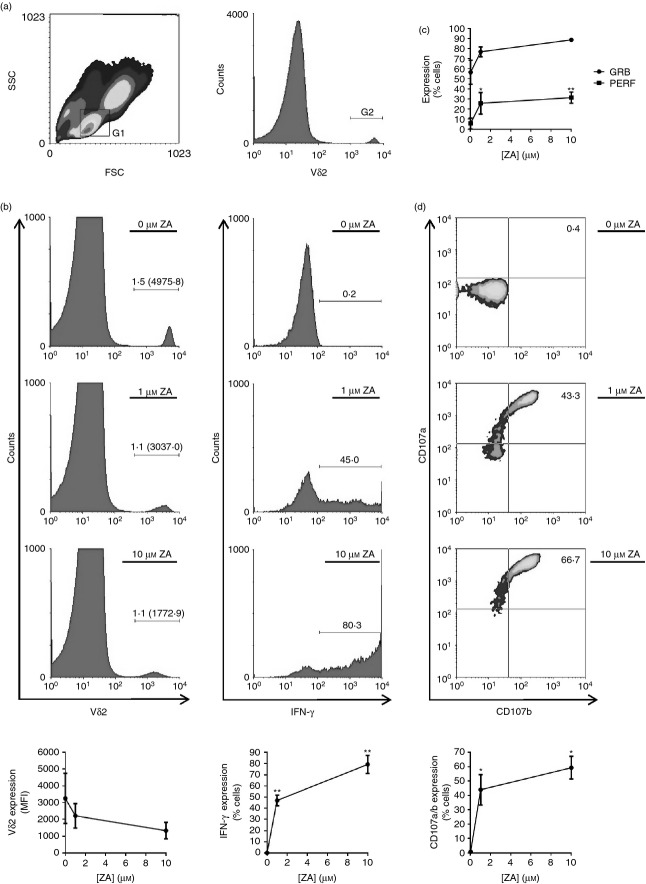
Figure 1.
Vδ2 cells within zoledronic acid (ZA) -treated peripheral blood mononuclear cells (PBMCs) degranulate. PBMCs were cultured overnight with 0, 1 or 10 μm ZA before flow cytometric analysis of Vδ2, interferon-γ (IFN-γ), granzyme B, perforin, CD107a and CD107b expression. (a) Representative flow cytometric plots depicting the gating strategy. Lymphocytes were gated according to size (forward scatter; FSC) and granularity (side scatter; SSC) using gate (G) 1, and Vδ2+ cells within G1 were gated using G2. (b) Representative flow cytometric plots and means ± SD for three different donors showing Vδ2 expression within G1 cells and IFN-γ expression within G1 + G2 cells. Numbers on flow cytometric plots are percentages of cells with mean fluorescence intensities (MFI) in parentheses. (c) Means ± SD for three different donors for granzyme B (GRB) and perforin (PERF) expression within G1 + G2 cells. (d) Representative flow cytometric plots and means ± SD for three different donors showing CD107a and CD107b expression within G1 + G2 cells. Numbers on flow cytometric plots are percentages of cells. For statistical analyses, analyses of variance were conducted followed by Bonferroni’s multiple comparison tests. * and ** indicate P values of < 0·05 and < 0·01, respectively, between treatment groups and controls.

