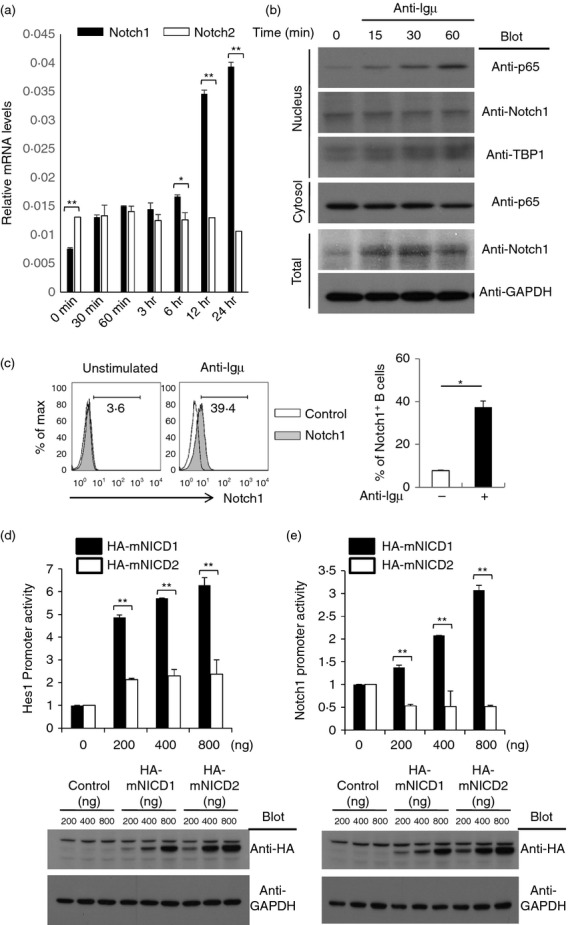
Figure 4.

Notch1 level was greatly increased by B-cell receptor ligation while the Notch2 level was slightly increased. (a) B cells were isolated from C57BL/6 mice and stimulated with an anti-µ F(ab)2 antibody for the indicated amount of time. RNA was isolated from the stimulated cells. The mRNA levels of Notch1 and Notch2 were analysed by quantitative RT-PCR analysis and are shown relative to the level to GAPDH mRNA. (b) From the B cells stimulated with anti-µ F(ab)2, total proteins, nuclear extracts and cytosolic proteins were prepared and the proteins were analysed by immunoblot analysis with the indicated antibodies. (c) The isolated B cells were stimulated with anti-µ F(ab)2 or anti-µ F(ab)2 antibodies for 24 hr. The activated cells were stained with fluorochrome-conjugated anti-Notch1 antibodies and analysed by flow cytometry. (d, e) Hes-1 promoter activities (d) and Notch1 promoter activities (e) were analysed by luciferase reporter assays as described in the Materials and methods. Reporter plasmids were co-transfected with the indicated amounts of empty control vector or HA-mNICD1 or HA-mNICD2 expression vectors into HEK293 cells. Expression of mNICD1 and mNICD2 was analysed by immunoblot analysis with anti-HA antibodies. Data are representative of three (a, c, d and e) or two (b) independent experiments. Student’s t-test: *P < 0·05; **P < 0·01.
