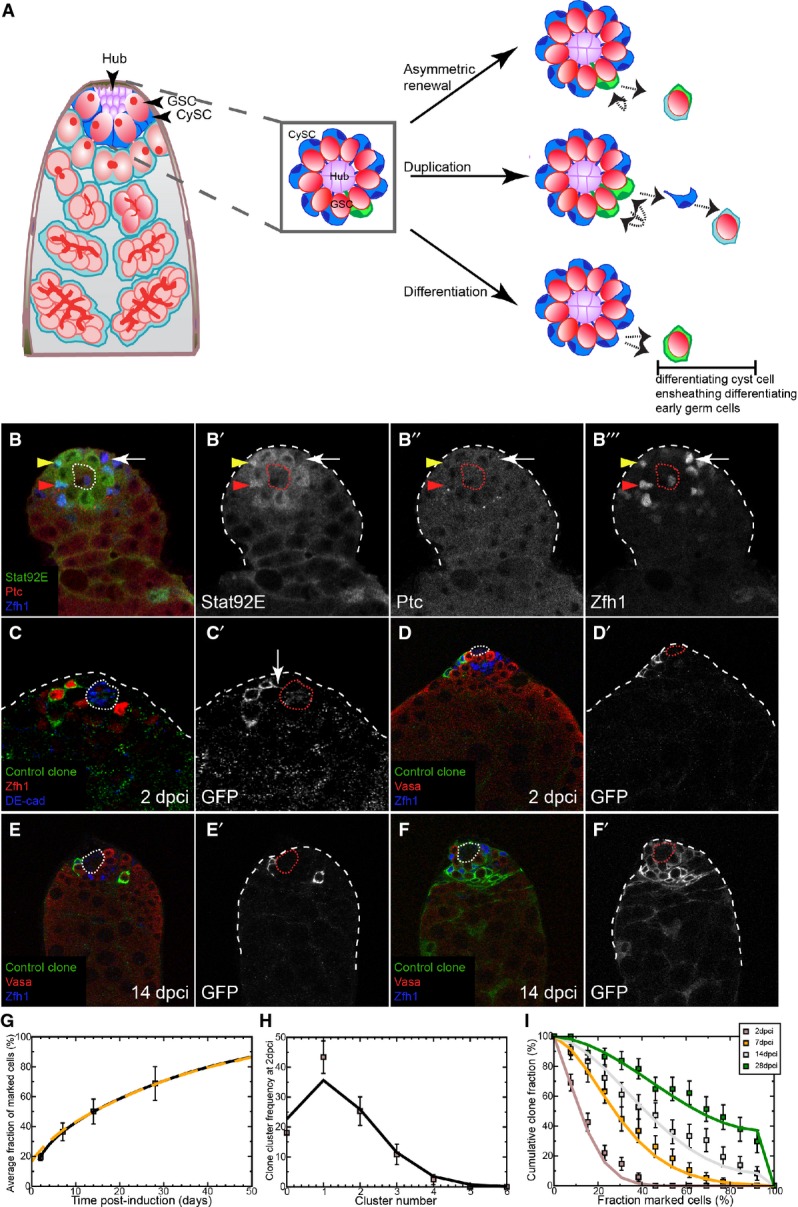
Figure 1. Characterizing the CySC pool.

A Left: Schematic of the apical tip of the Drosophila testis. GSCs (red) and CySCs (dark blue) contact the hub (purple). Differentiating progeny move away from the hub to form germ cysts (red), which are ensheathed by two cyst cells (light blue). Center: Boxed enlargement showing that CySCs form a ring around the hub and contact the hub in between the GSCs. The CySC nucleus (dark blue) resides just ‘behind’ the row of GSCs. A marked CySC (green) will undergo division with possible outcomes depicted at right. Right: In asymmetric renewal (top), the two daughters of the clone give rise to one CySC and one differentiating cyst cell, which ensheaths a gonialblast along with an unmarked cyst cell (light blue). In duplication (middle), both marked daughters remain at the niche as CySCs, displacing an unmarked CySC (blue) in the process. This displaced unmarked cell differentiates into an ensheathing cyst cell. In differentiation (bottom), both daughters of the marked CySC differentiate into cyst cells, resulting in no marked CySCs at the hub.
B A control testis labeled with Stat92E (green, single channel B’), Ptc (red, single channel B”), and Zfh1 (blue, single channel B’”) showing that while some Zfh1-positive cells co-labeled for Ptc and Stat92E (red arrowhead), others were only positive for one factor (yellow arrowhead) or for neither (arrow).
C CySC MARCM clones labeled with membrane-targeted CD8-GFP (C’) showing identifiable single cells, some of which contacted the hub (DE-cadherin, blue) with membrane extensions (arrow in C’).
D–F Clonal analysis, GFP (single channels D’–F’) indicates the clone, Vasa (red) labels germ cells and Zfh1 (blue) CySCs and early cyst cells; the hub is indicated by a dotted line. GFP-labeled control clones were generated by the MARCM technique and analyzed at 2 (D) and 14 dpci (E, F). Although clones were small at 2 dpci (D), they varied markedly by 14 dpci (E, F).
G Variation of average size of control clones as a function of time. The data points (boxes) show the mean fraction of labeled CySCs in persisting clones. The black line shows a fit of the neutral drift model to the data using an induction frequency of CySCs at a ratio of one in 10 (i.e., 10%). The dashed orange line represents the predicted clonal evolution if only a single CySC clone was induced with a time-shift of 3 days with the same set of parameters. One may note that the clone sizes observed from multiple independent induction events and from a single induction event converge rapidly. For details of the neutral drift model and the notation, see Supplementary Materials and Methods. n = 83, 74, 73, 81 for 2, 7, 14, 28 dpci, respectively. Error bars denote SEM.
H Comparison of observed (boxes) and predicted (line) frequency of clusters of somatic cell clones. Each cluster is presumed to represent an independent labeling event. The line was generated by a least-squares fit and suggests a labeling efficiency of 11% (q = 0.11). Error bars denote SEM.
I Distribution of persisting clone sizes in wild-type testes. The boxes show experimental data, and lines show the predictions of the model. n = 83, 74, 73, 81 for 2, 7, 14, 28 dpci, respectively. Error bars denote SEM.
