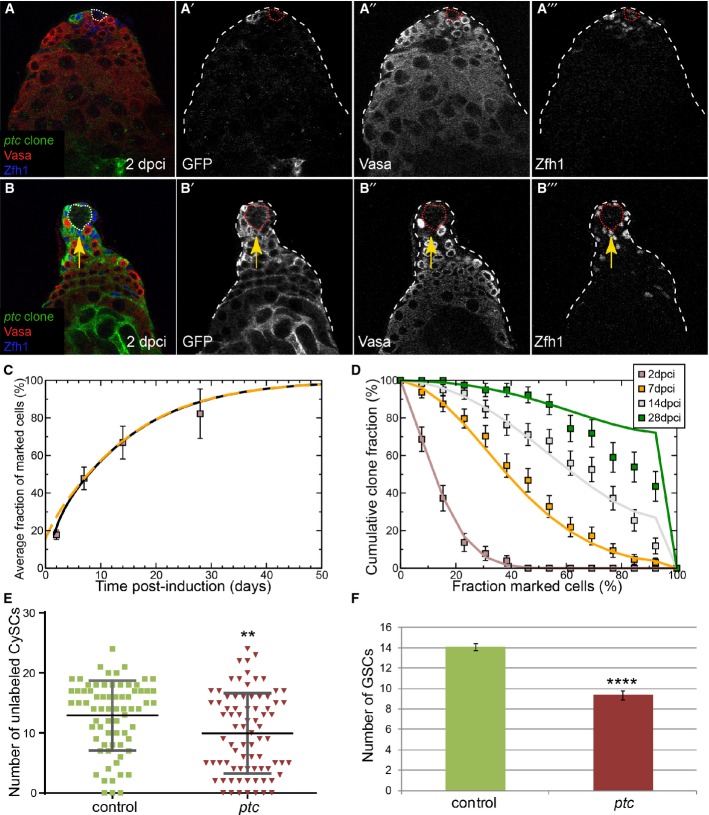
Figure 2. Neutral drift dynamics are skewed by ptc mutant clones.
A, B Clonal analysis, GFP (single channels A’, B’) indicates the clone, Vasa (red, single channels A”, B”) labels germ cells and Zfh1 (blue, single channels A’”, B’”) CySCs and early cyst cells; the hub is indicated by a dotted line. GFP-labeled ptc mutant clones were generated by the MARCM technique and analyzed at 2 (A) and 14 dpci (B). Arrow (B–B’”) shows displacement of GSCs by ptc mutant CySCs.
C Variation of average size of ptc mutant clones as a function of time. The data points (boxes) show the mean fraction of labeled CySCs in persisting clones. The black line shows a fit of the neutral drift model, modified to have a bias in favor of the labeled cell, to the data using an induction frequency of 10%. The dashed orange line represents the predicted clonal evolution if only a single CySC clone were induced with a time-shift of 3 days with the same set of parameters. One may note that the clone sizes observed from multiple independent induction events and from a single induction event converge rapidly. For details of the biased drift model and the notation, see Supplementary Materials and Methods. n = 63, 81, 79, 66 for 2, 7, 14, 28 dpci, respectively. Error bars denote SEM.
D Distribution of clone sizes of persistent ptc mutant clones. The boxes show experimental data, and lines show the predictions of the model. Error bars denote SEM.
E Number of unlabeled CySCs at 14 dpci in testes containing either control (green) or ptc mutant (red) clones. Lines show mean and standard deviation. Asterisks denote statistically significant difference from control. n = 73 and 79 for control and ptc mutant, respectively.
F Number of GSCs at 14 dpci when control or ptc CySC clones were present. ptc mutant CySCs displaced wild-type GSCs, leading to a significant decrease in the number of GSCs. Asterisks denote statistically significant difference from control. n = 48 and 49 for control and ptc mutant, respectively. Error bars denote SEM.

