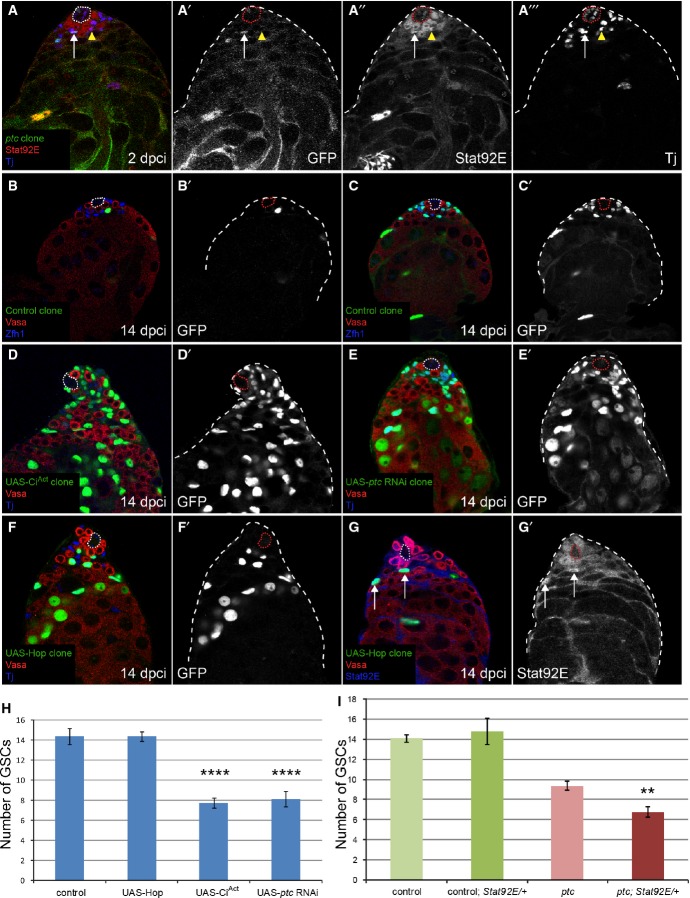
Figure 3. Clonal overactivation of the Hh pathway, but not JAK/STAT, causes niche competition phenotypes.
A No increase in Stat92E staining (red, single channel in A”) was seen in a ptc mutant CySC (green, arrow, single channel in A’) compared to neighboring wild-type CySCs (arrowhead) at 2 dpci. Somatic cells were labeled with Tj (blue, single channel in A’”). See also Supplementary Fig S5 for Stat92E staining in clones at 7 and 14 dpci.
B–G MARCM clones at 14 dpci, with single channels showing the clone marker GFP in (B’–F’), Vasa in red and Zfh1 (B, C) or Tj (D–F) in blue. Control clones (B, C) showed variation in the number of cells labeled. Overexpression of CiAct (D) or RNAi against ptc (E) recapitulated the ptc mutant phenotype (compare with Fig 2B), but overexpression of Hop did not (F). Hop overexpression activated JAK/STAT signaling (G), as seen by stabilization of Stat92E protein (blue, single channel in G’) in the clones (green, arrows).
H Number of GSCs at 14 dpci when CySC clones of the indicated genotype were induced. Hop overexpression did not affect GSC number, while CiAct and ptc RNAi-expressing clones caused loss of GSCs, similar to ptc mutant clones (see Fig 2F). Asterisks denote statistically significant change from control. n = 15, 24, 27, 8 for control, UAS-Hop, UAS-CiAct, UAS-ptc RNAi, respectively. Error bars denote SEM.
I Number of GSCs at 14 dpci when control or ptc mutant CySCs were present, showing an enhancement of GSC loss when ptc mutant clones were induced in a background lacking one copy of the Stat92E gene. Asterisks denote statistically significant change from the ptc mutant clones alone. n = 48 (control), 36 (control; Stat92E/+), 49 (ptc), 20 (ptc; Stat92E/+). Error bars denote SEM.

